Making a Truss Bridge

ENGS 33: Solid Mechanics @ Dartmouth College
Structural Design - SAP2000 - SolidWorks Simulation + FEA - Load Testing
Bridge render
Overview Ideation Design & Analysis Final Bridge & Predictions Testing Results
Project Snapshot
Bridge drawing or final render

Final bridge drawing / render.

Ideation

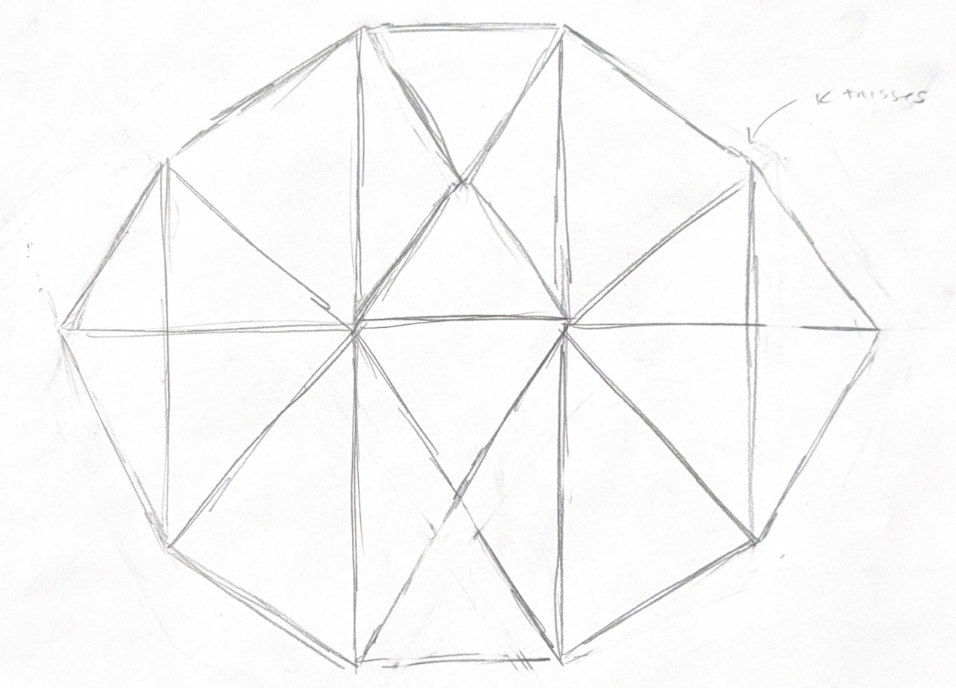
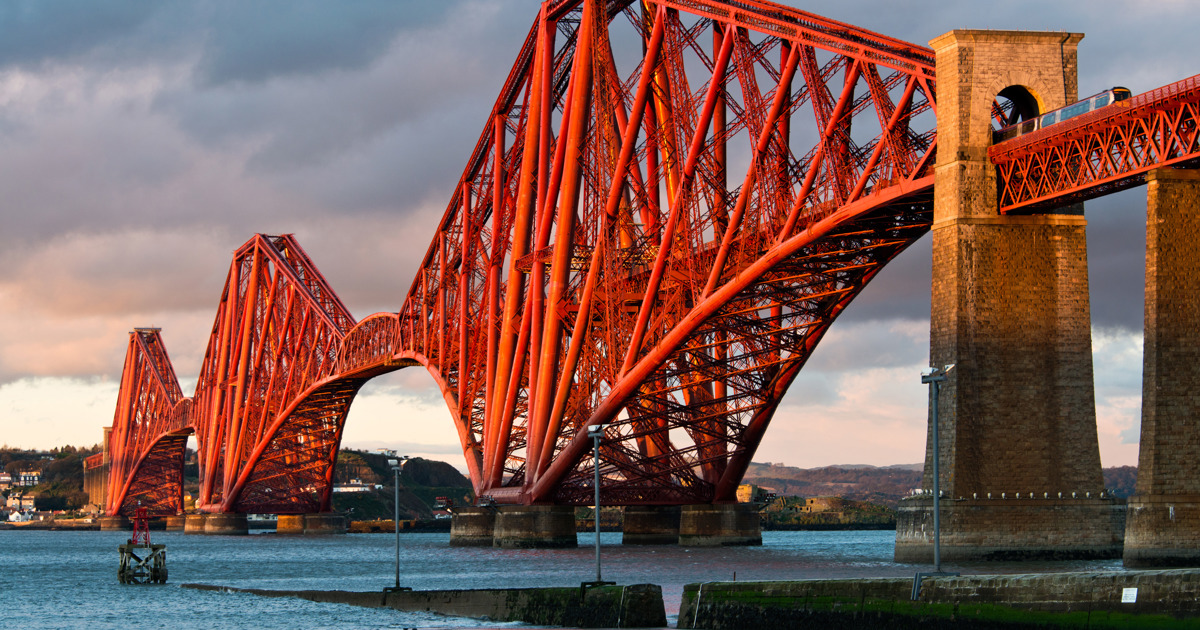
The design process began with research into existing truss bridge types, followed by multiple preliminary sketches exploring geometry, member layout, and overall form.

Preliminary sketch 1
Early concept sketches exploring truss layouts and deck configurations.
Bridge reference inspiration
Example bridge that inspired this design: (Forth Bridge).
Design & Analysis

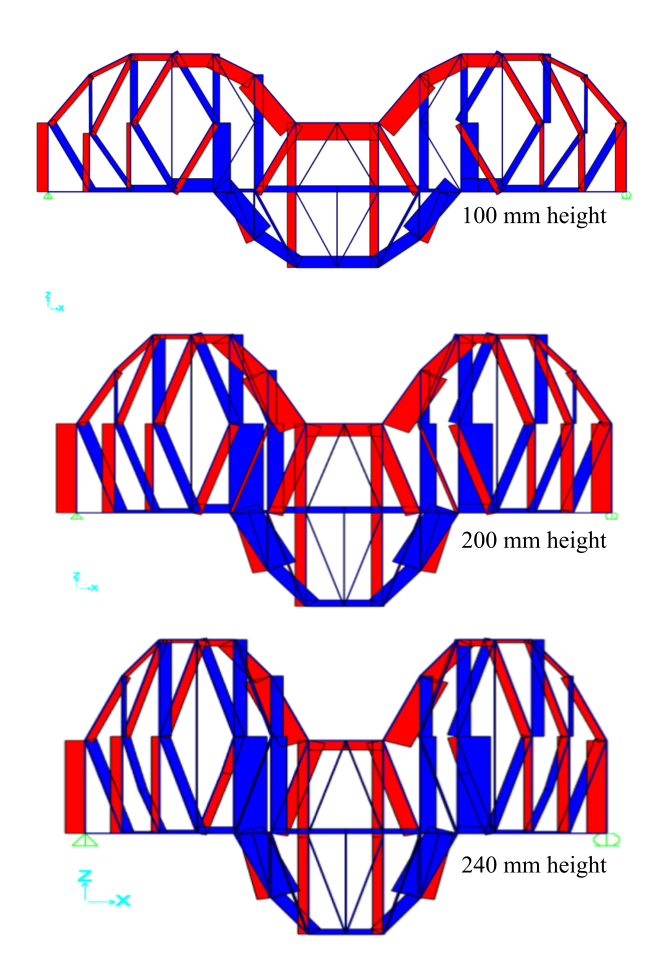
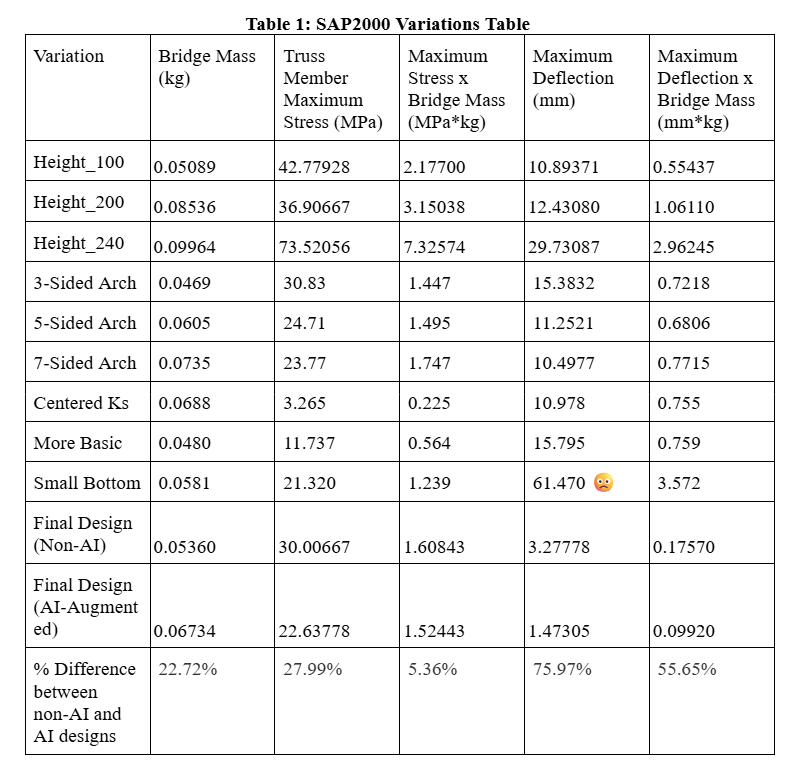
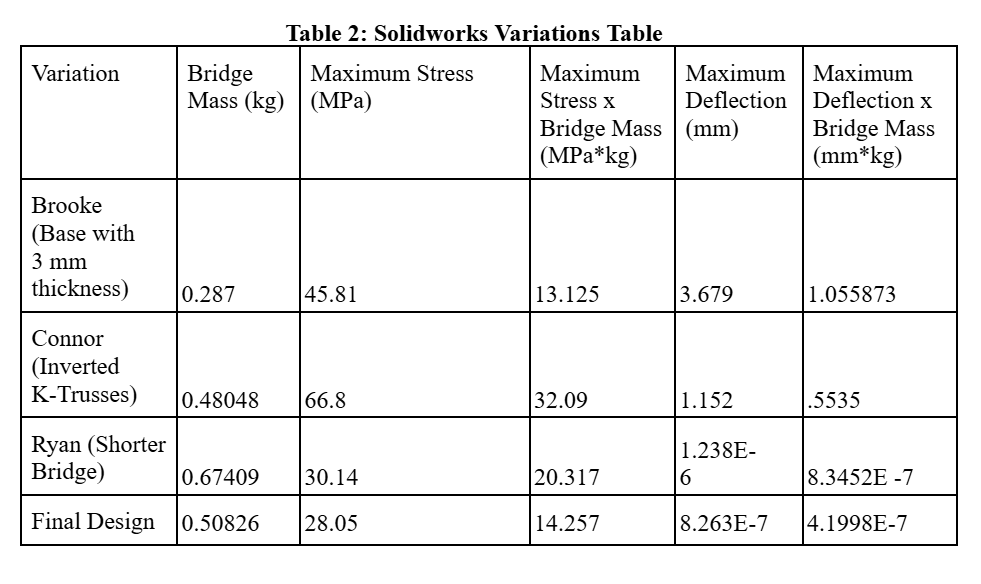
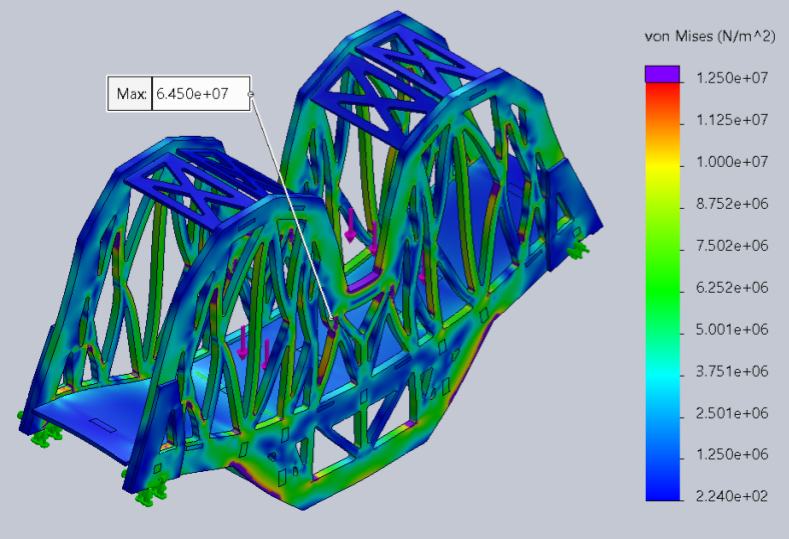
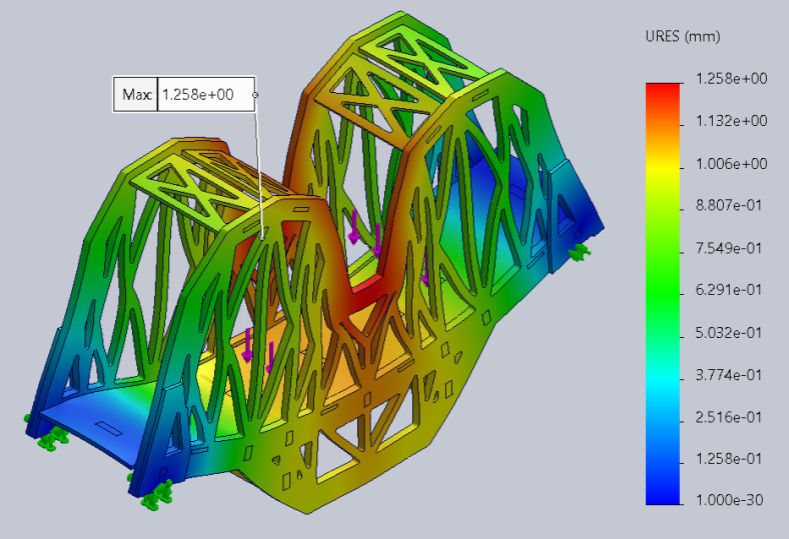
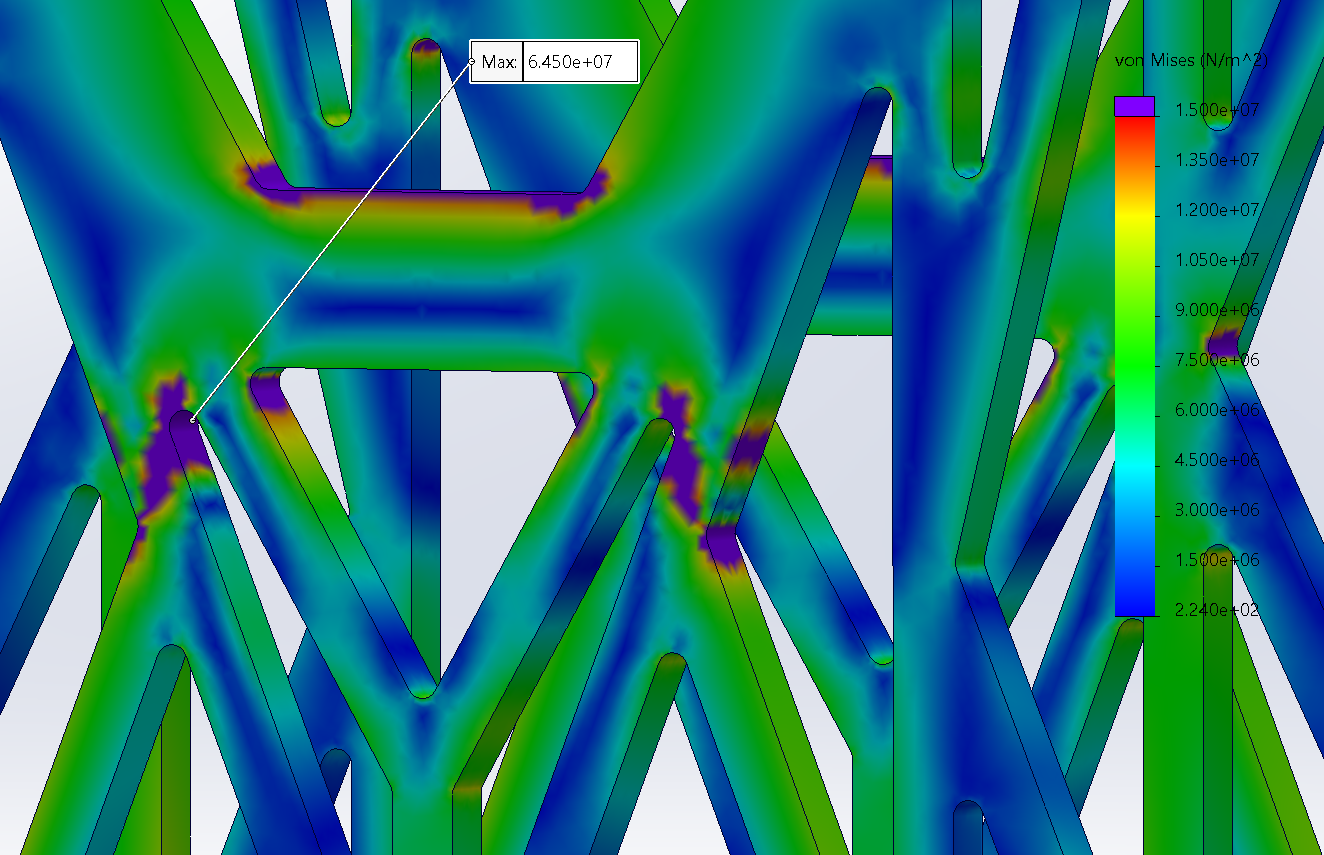
After selecting a concept, the bridge was iteratively refined through analytical and simulation-based modeling. SAP2000 was used to compare variations in geometry and member layout, while SolidWorks Simulation was used to evaluate stress, displacement, and likely failure regions.
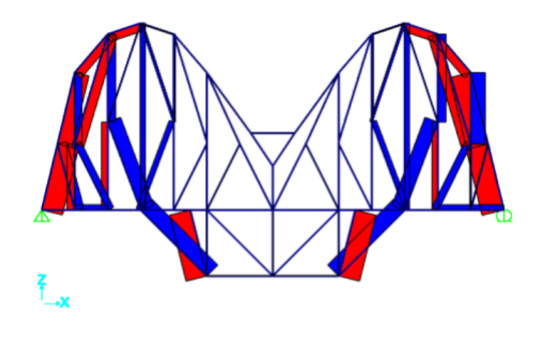
SAP2000 model
Phase 2: SAP2000 truss model used to evaluate design variations.
Final SAP model

Final SAP model.

SolidWorks comparison
Phase 3: SolidWorks variations with different wood widths and truss configurations. Comparisons were undertaken with stress and deflection plots (not shown). Top: Variation made by Brooke. Bottom: Variation made by Ryan Stern.
SAP2000 variation table
Phase 2: Results from stress and deflection analysis for different SAP2000 variations used to inform Phase 3 SolidWorks.
Variation Table
Phase 3: Results from stress and deflection analysis for three different SolidWorks variations.

Key design variables

Height, member orientation, bracing strategy, and member thickness.

What was optimized

Lower stress concentration, lower deflection, and better performance per unit mass.

Decision points

From the SAP 2000 2D analysis (Phase 2), to optimize these variables, a height of 130 mm, 5 different arches, and a k-truss configuration was chosen.

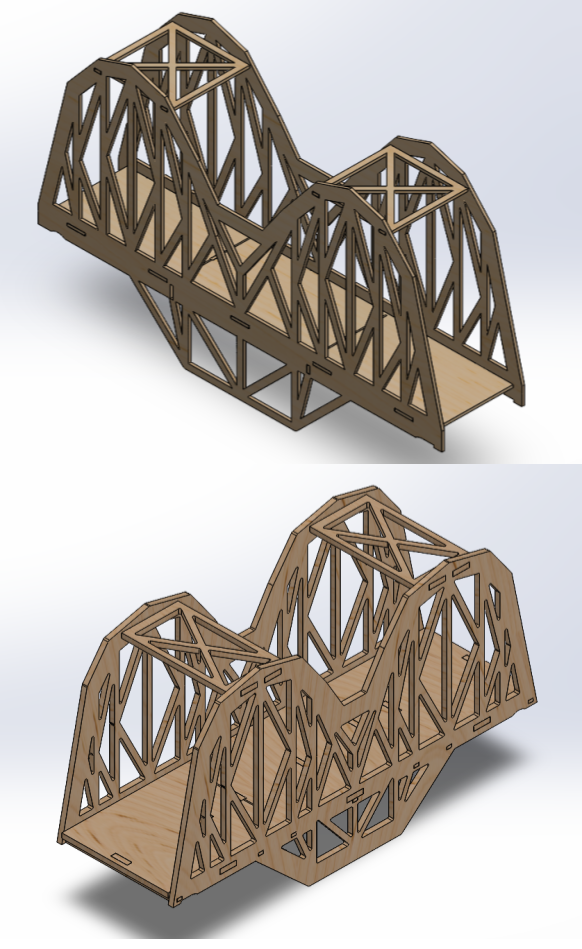
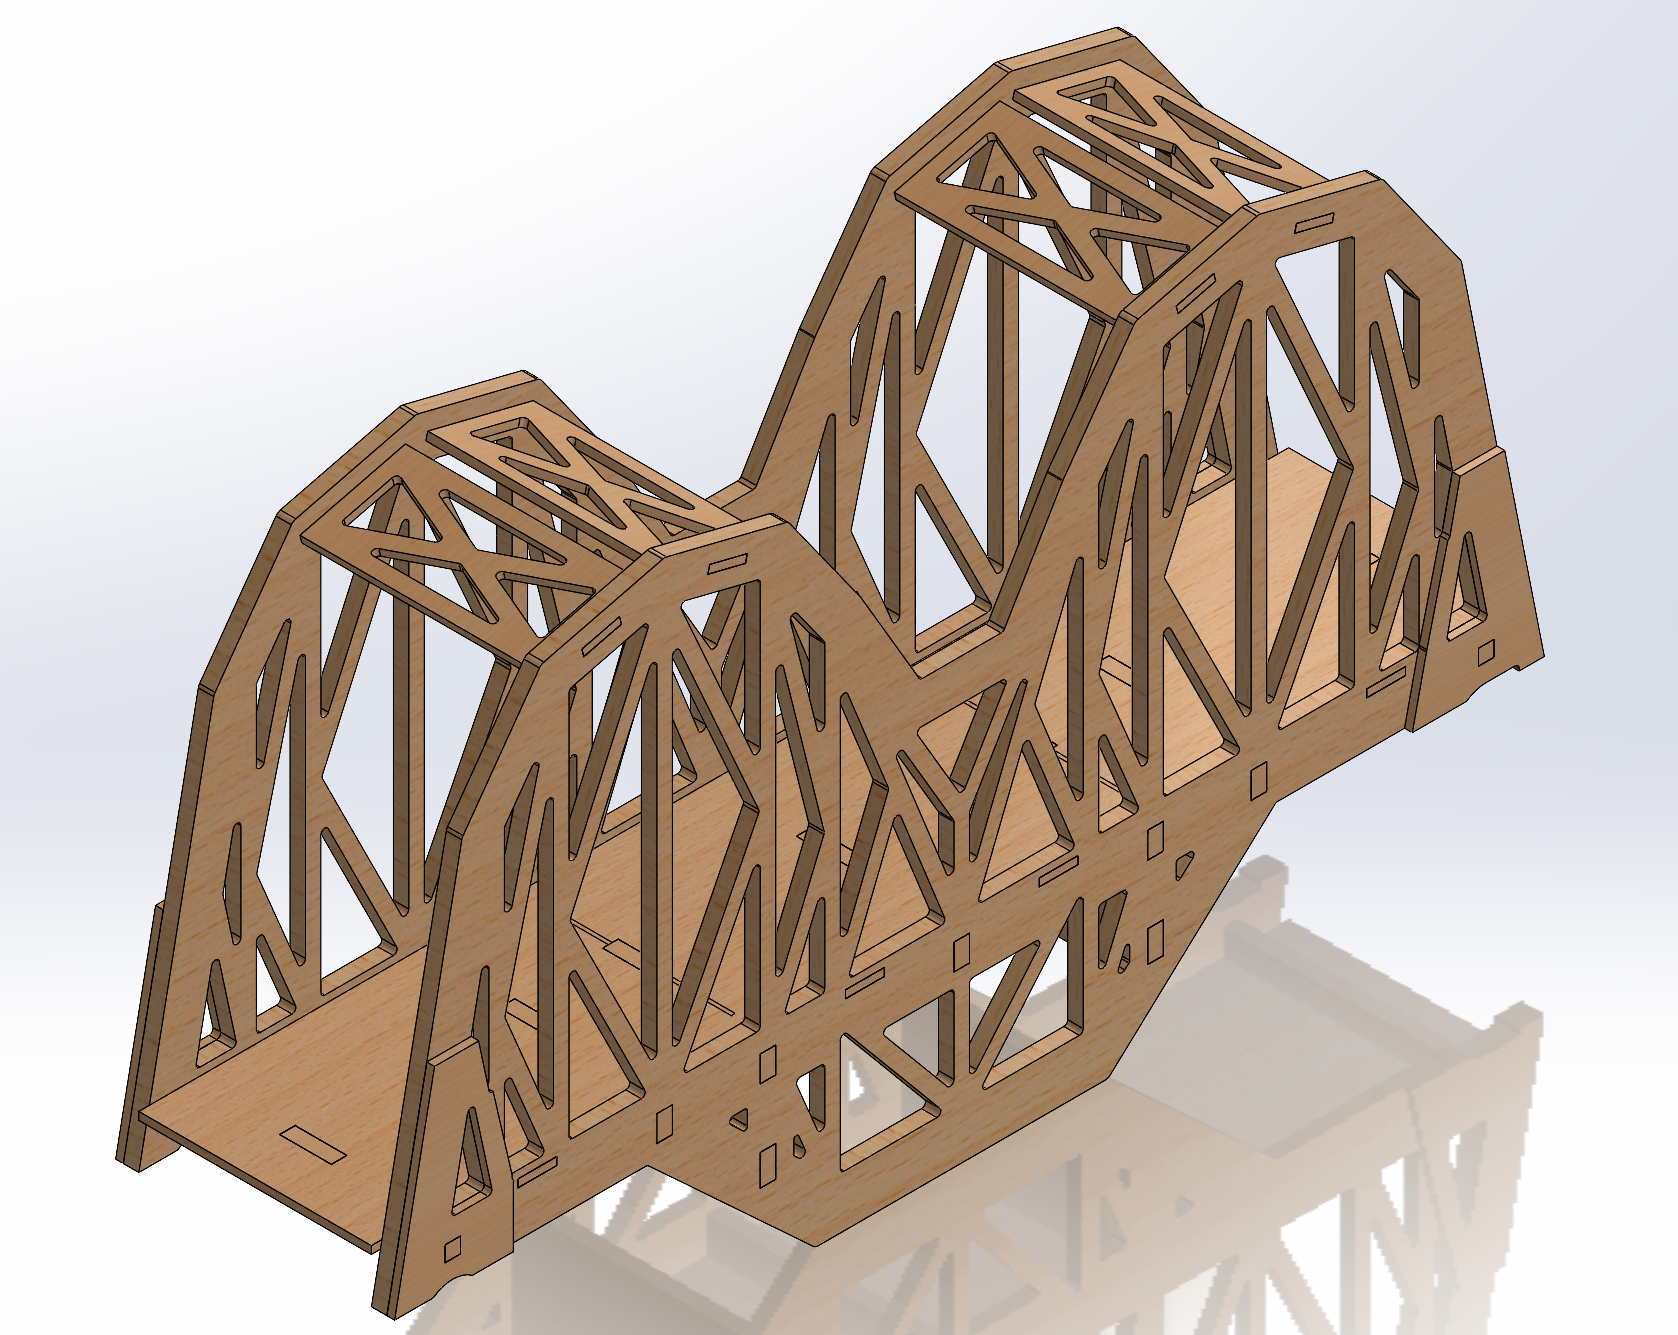
From the SolidWorks FEA analysis (Phase 3), a thinner deck, 0.5 kg mass, 6 mm crossmember x 7, and a K-truss configuration were maintained in the final bridge design.

Final Bridge and Predictions
Final bridge photo 1
Final bridge photo 2
Final bridge photo 3
Final bridge photo 4

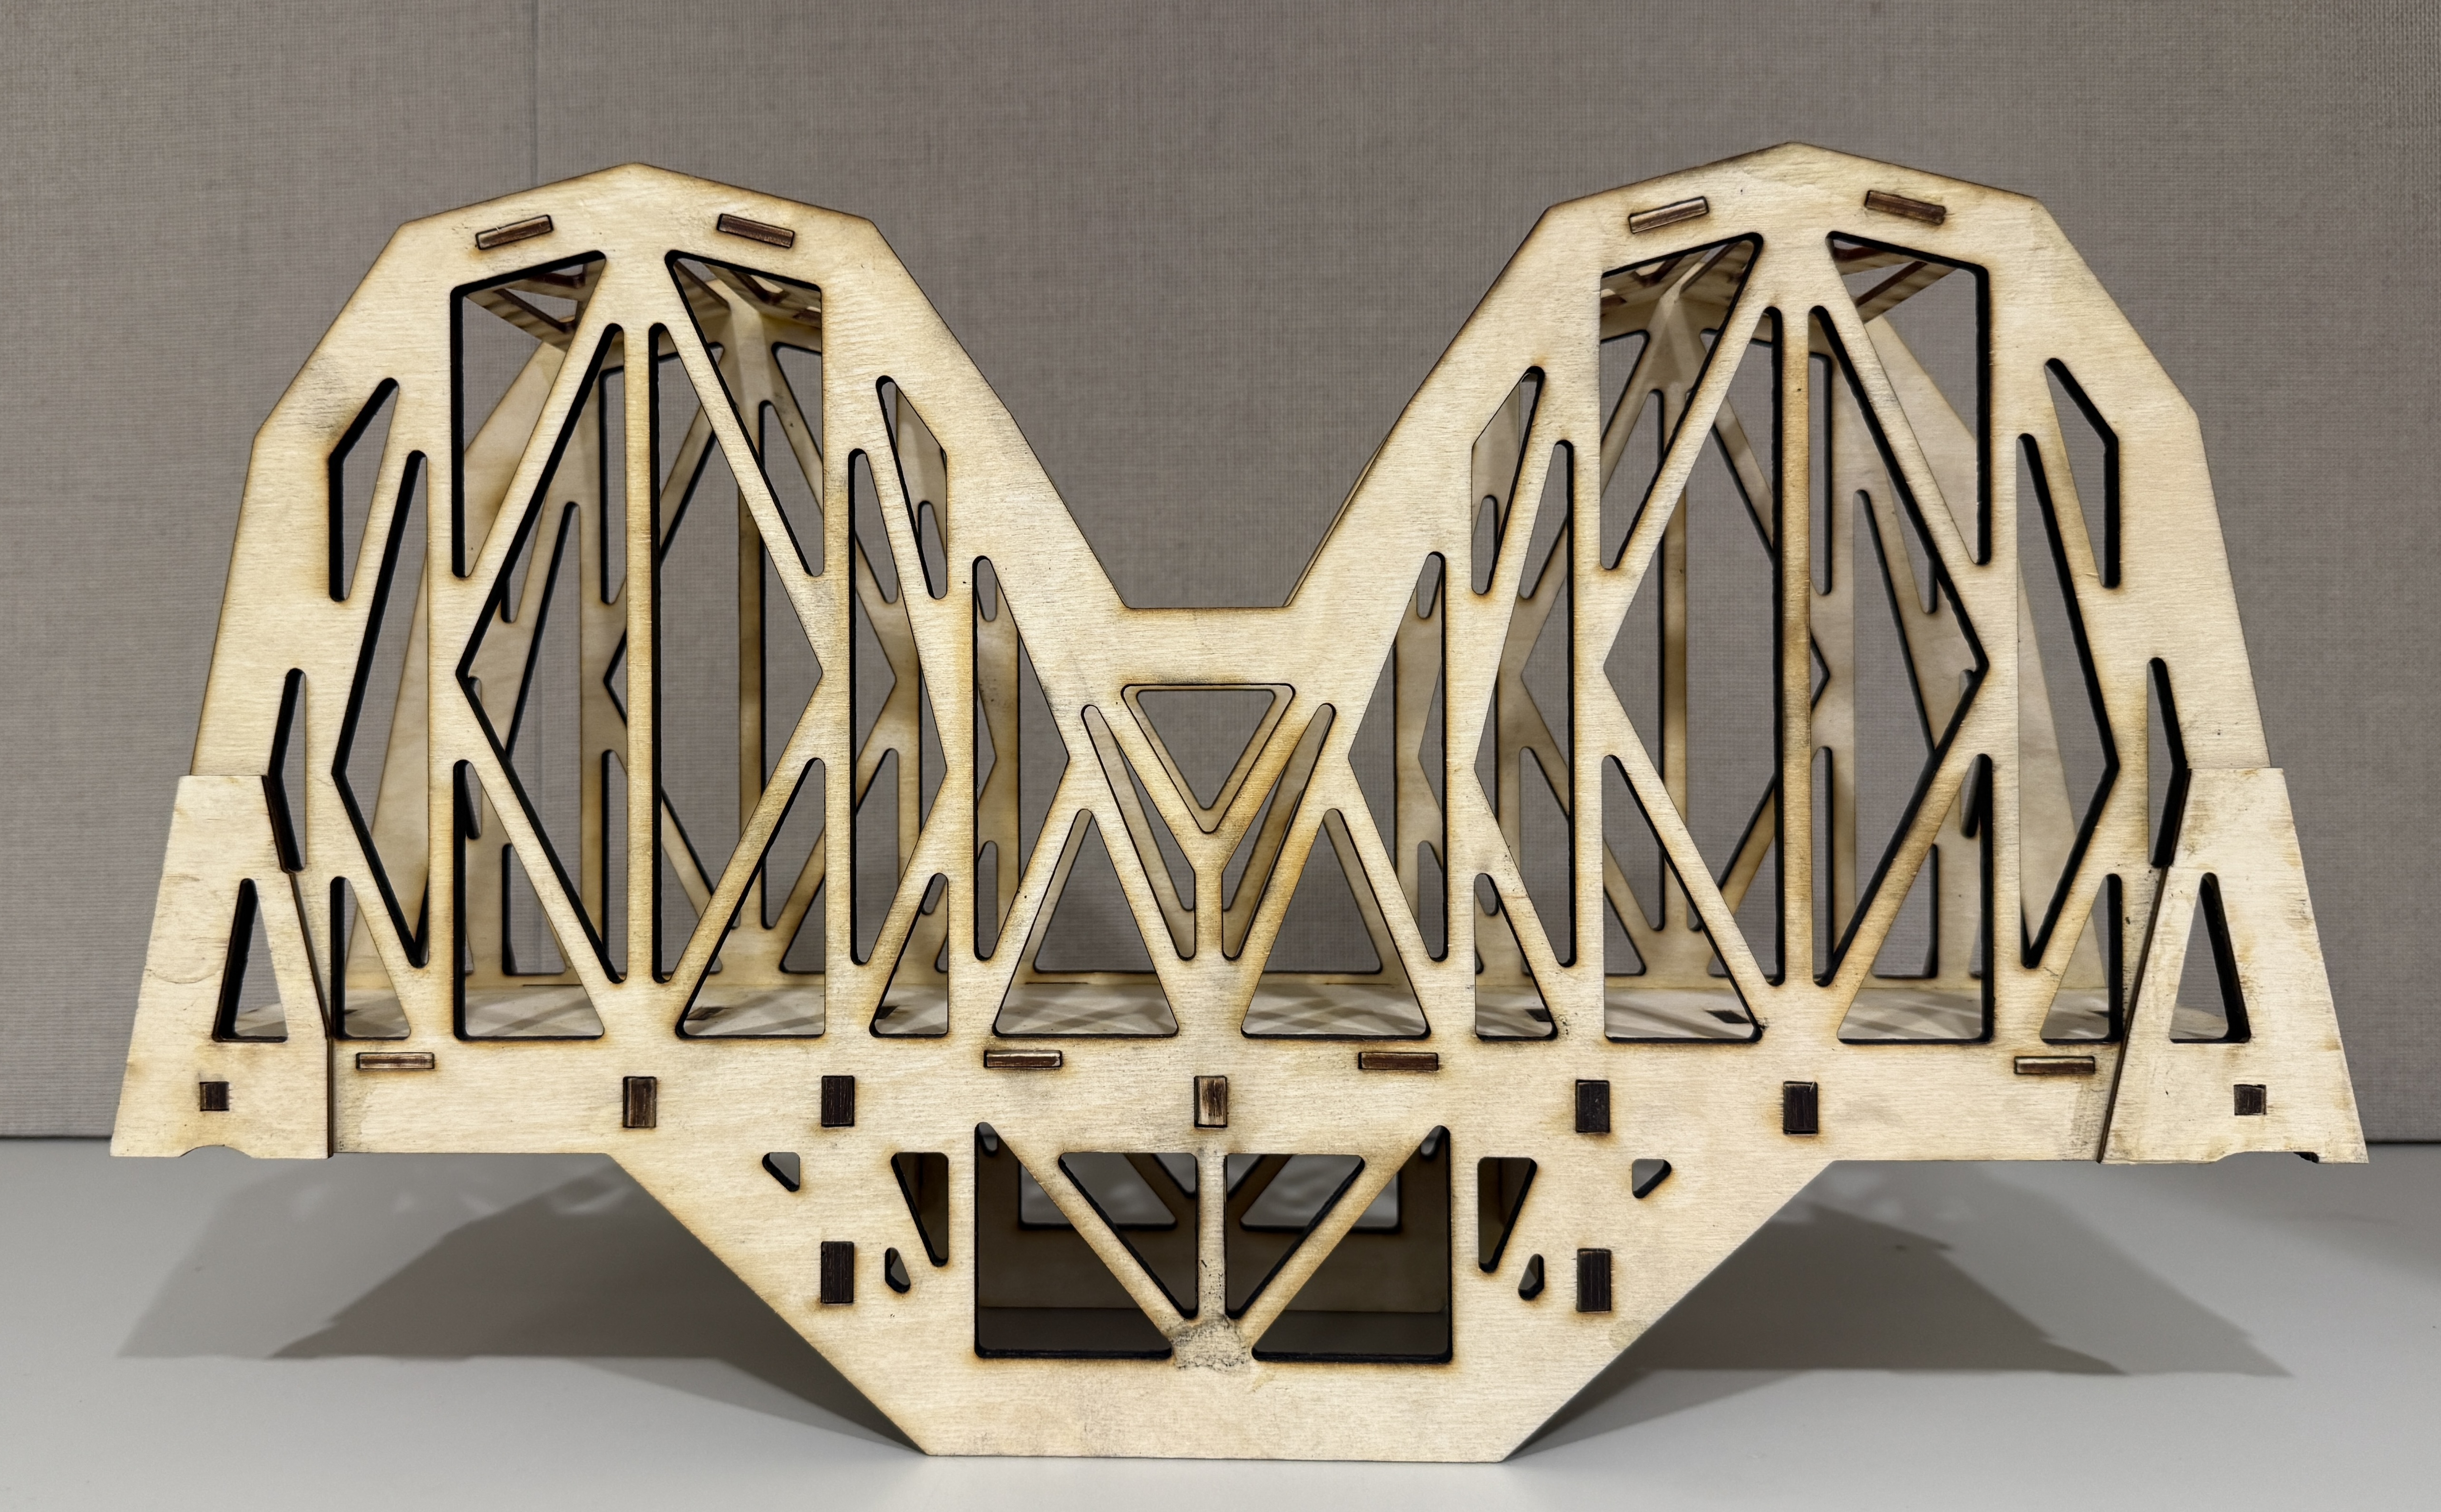
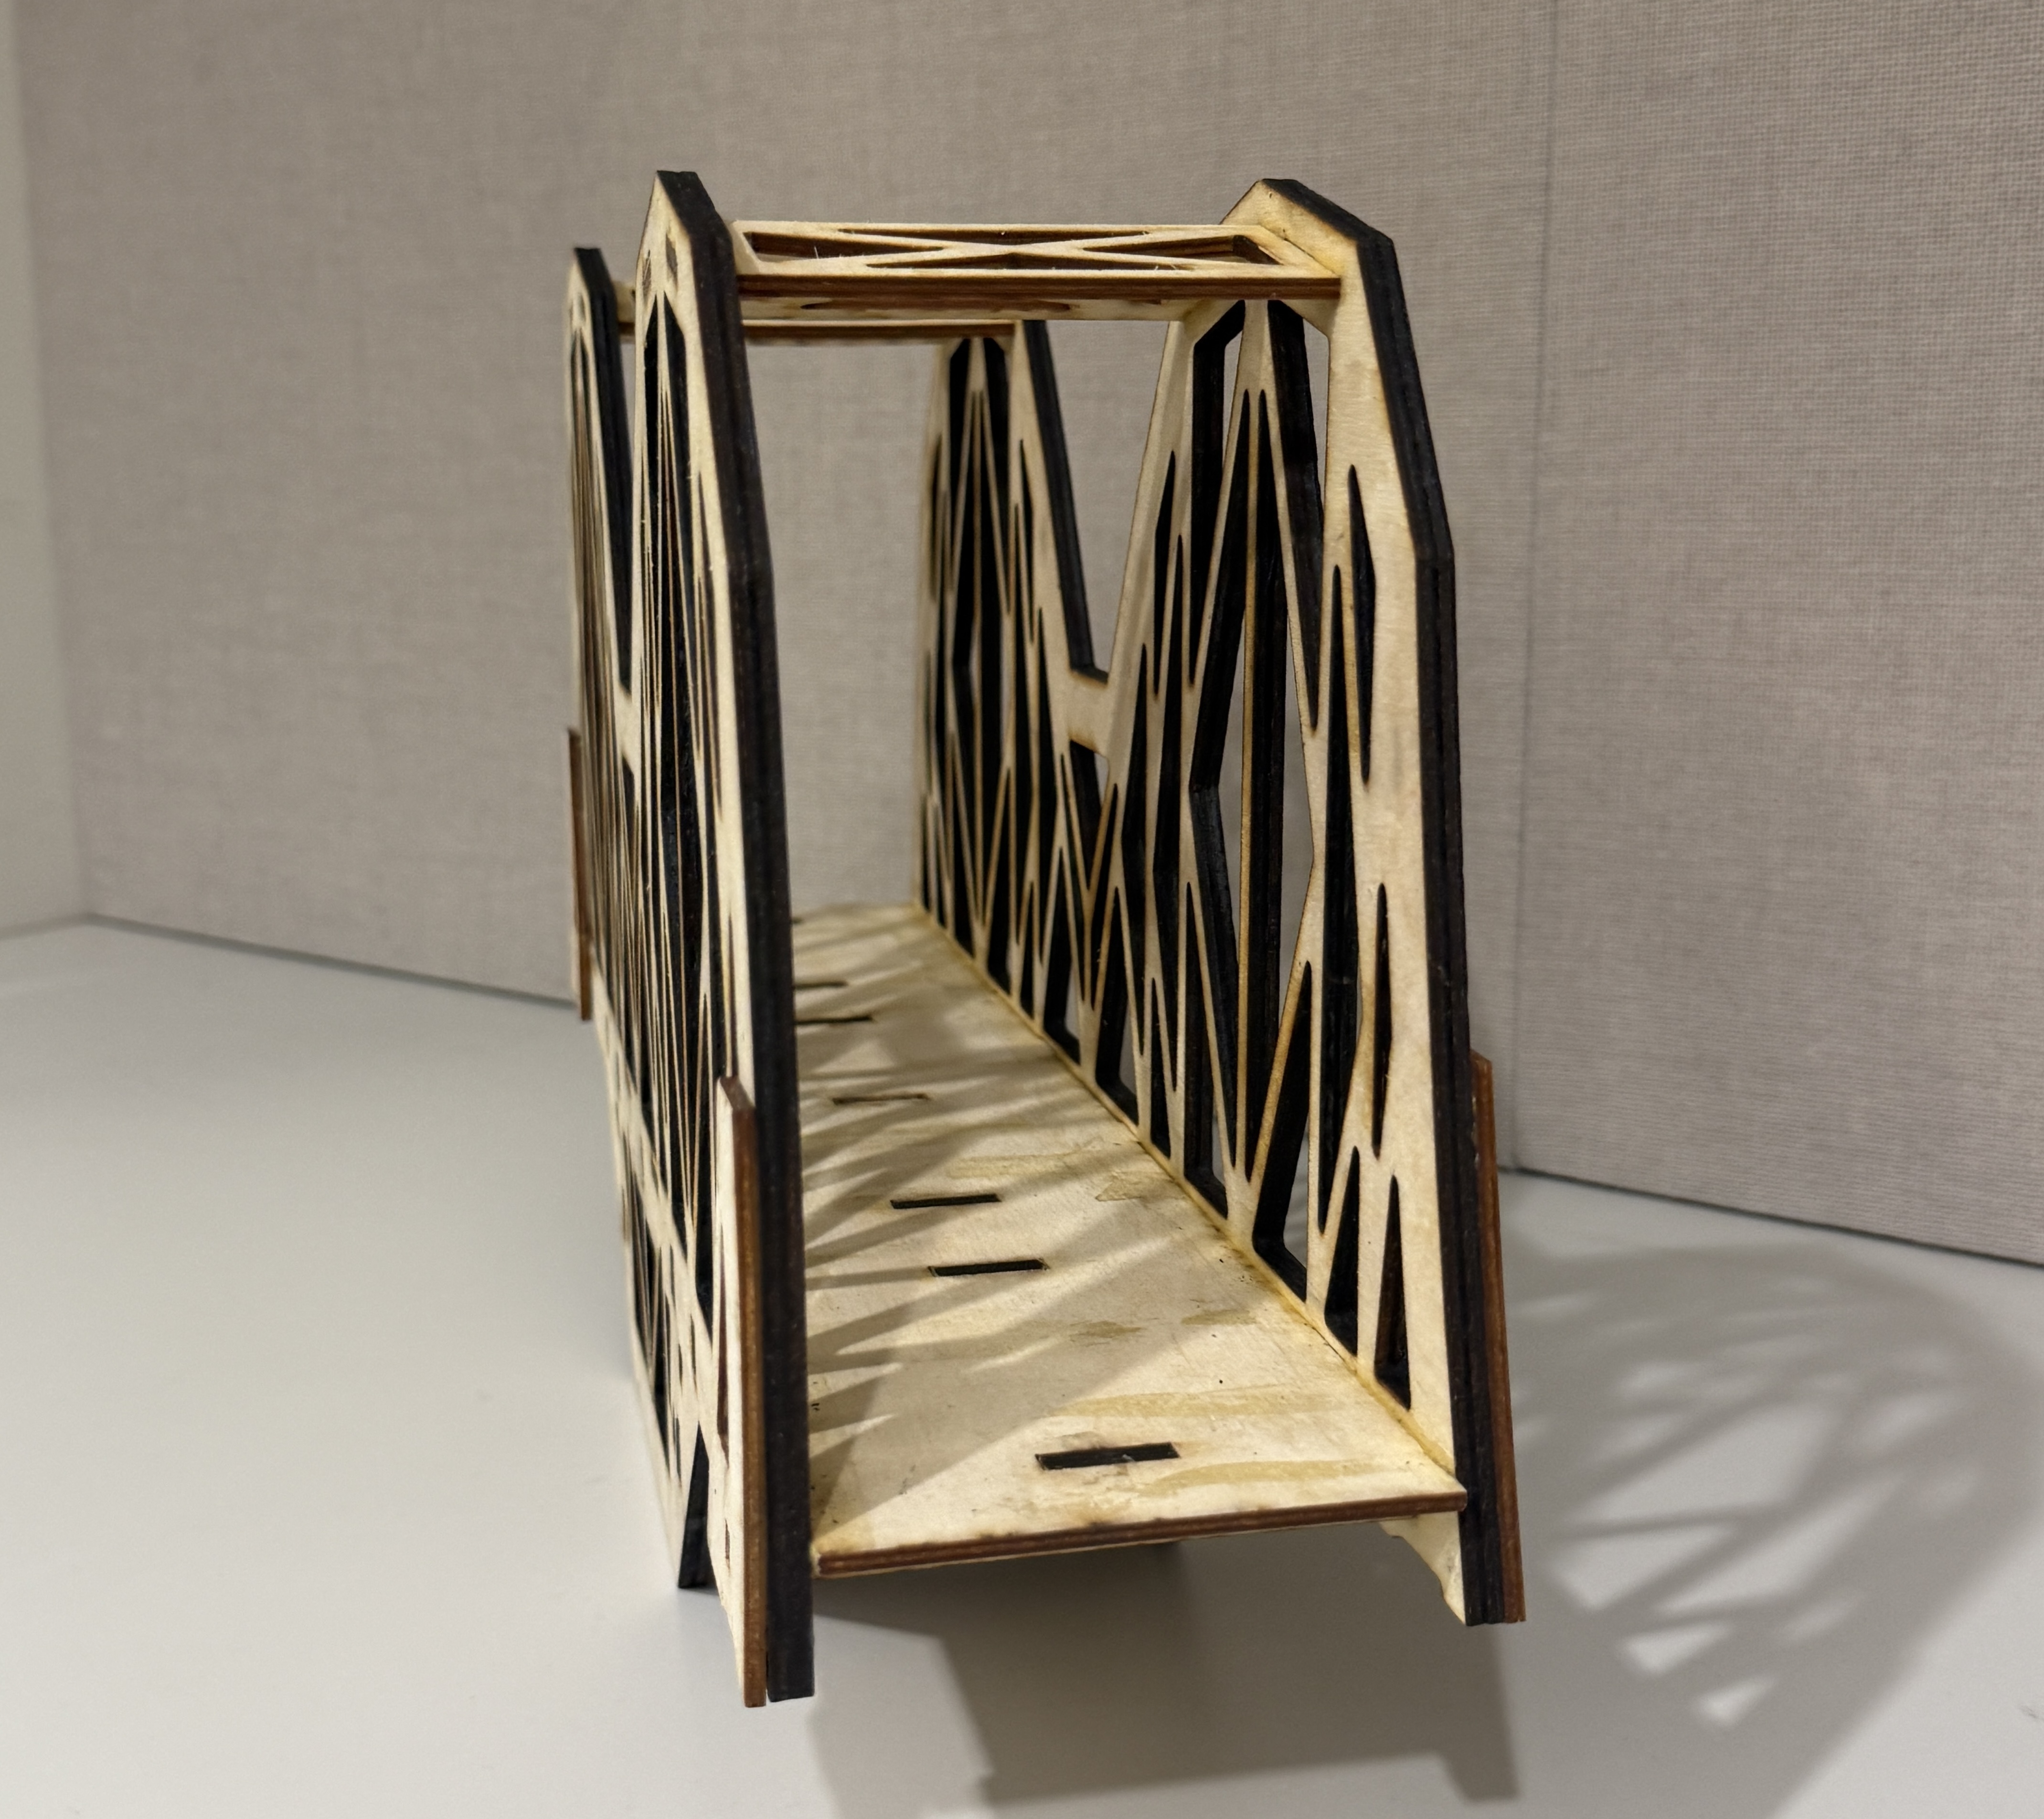
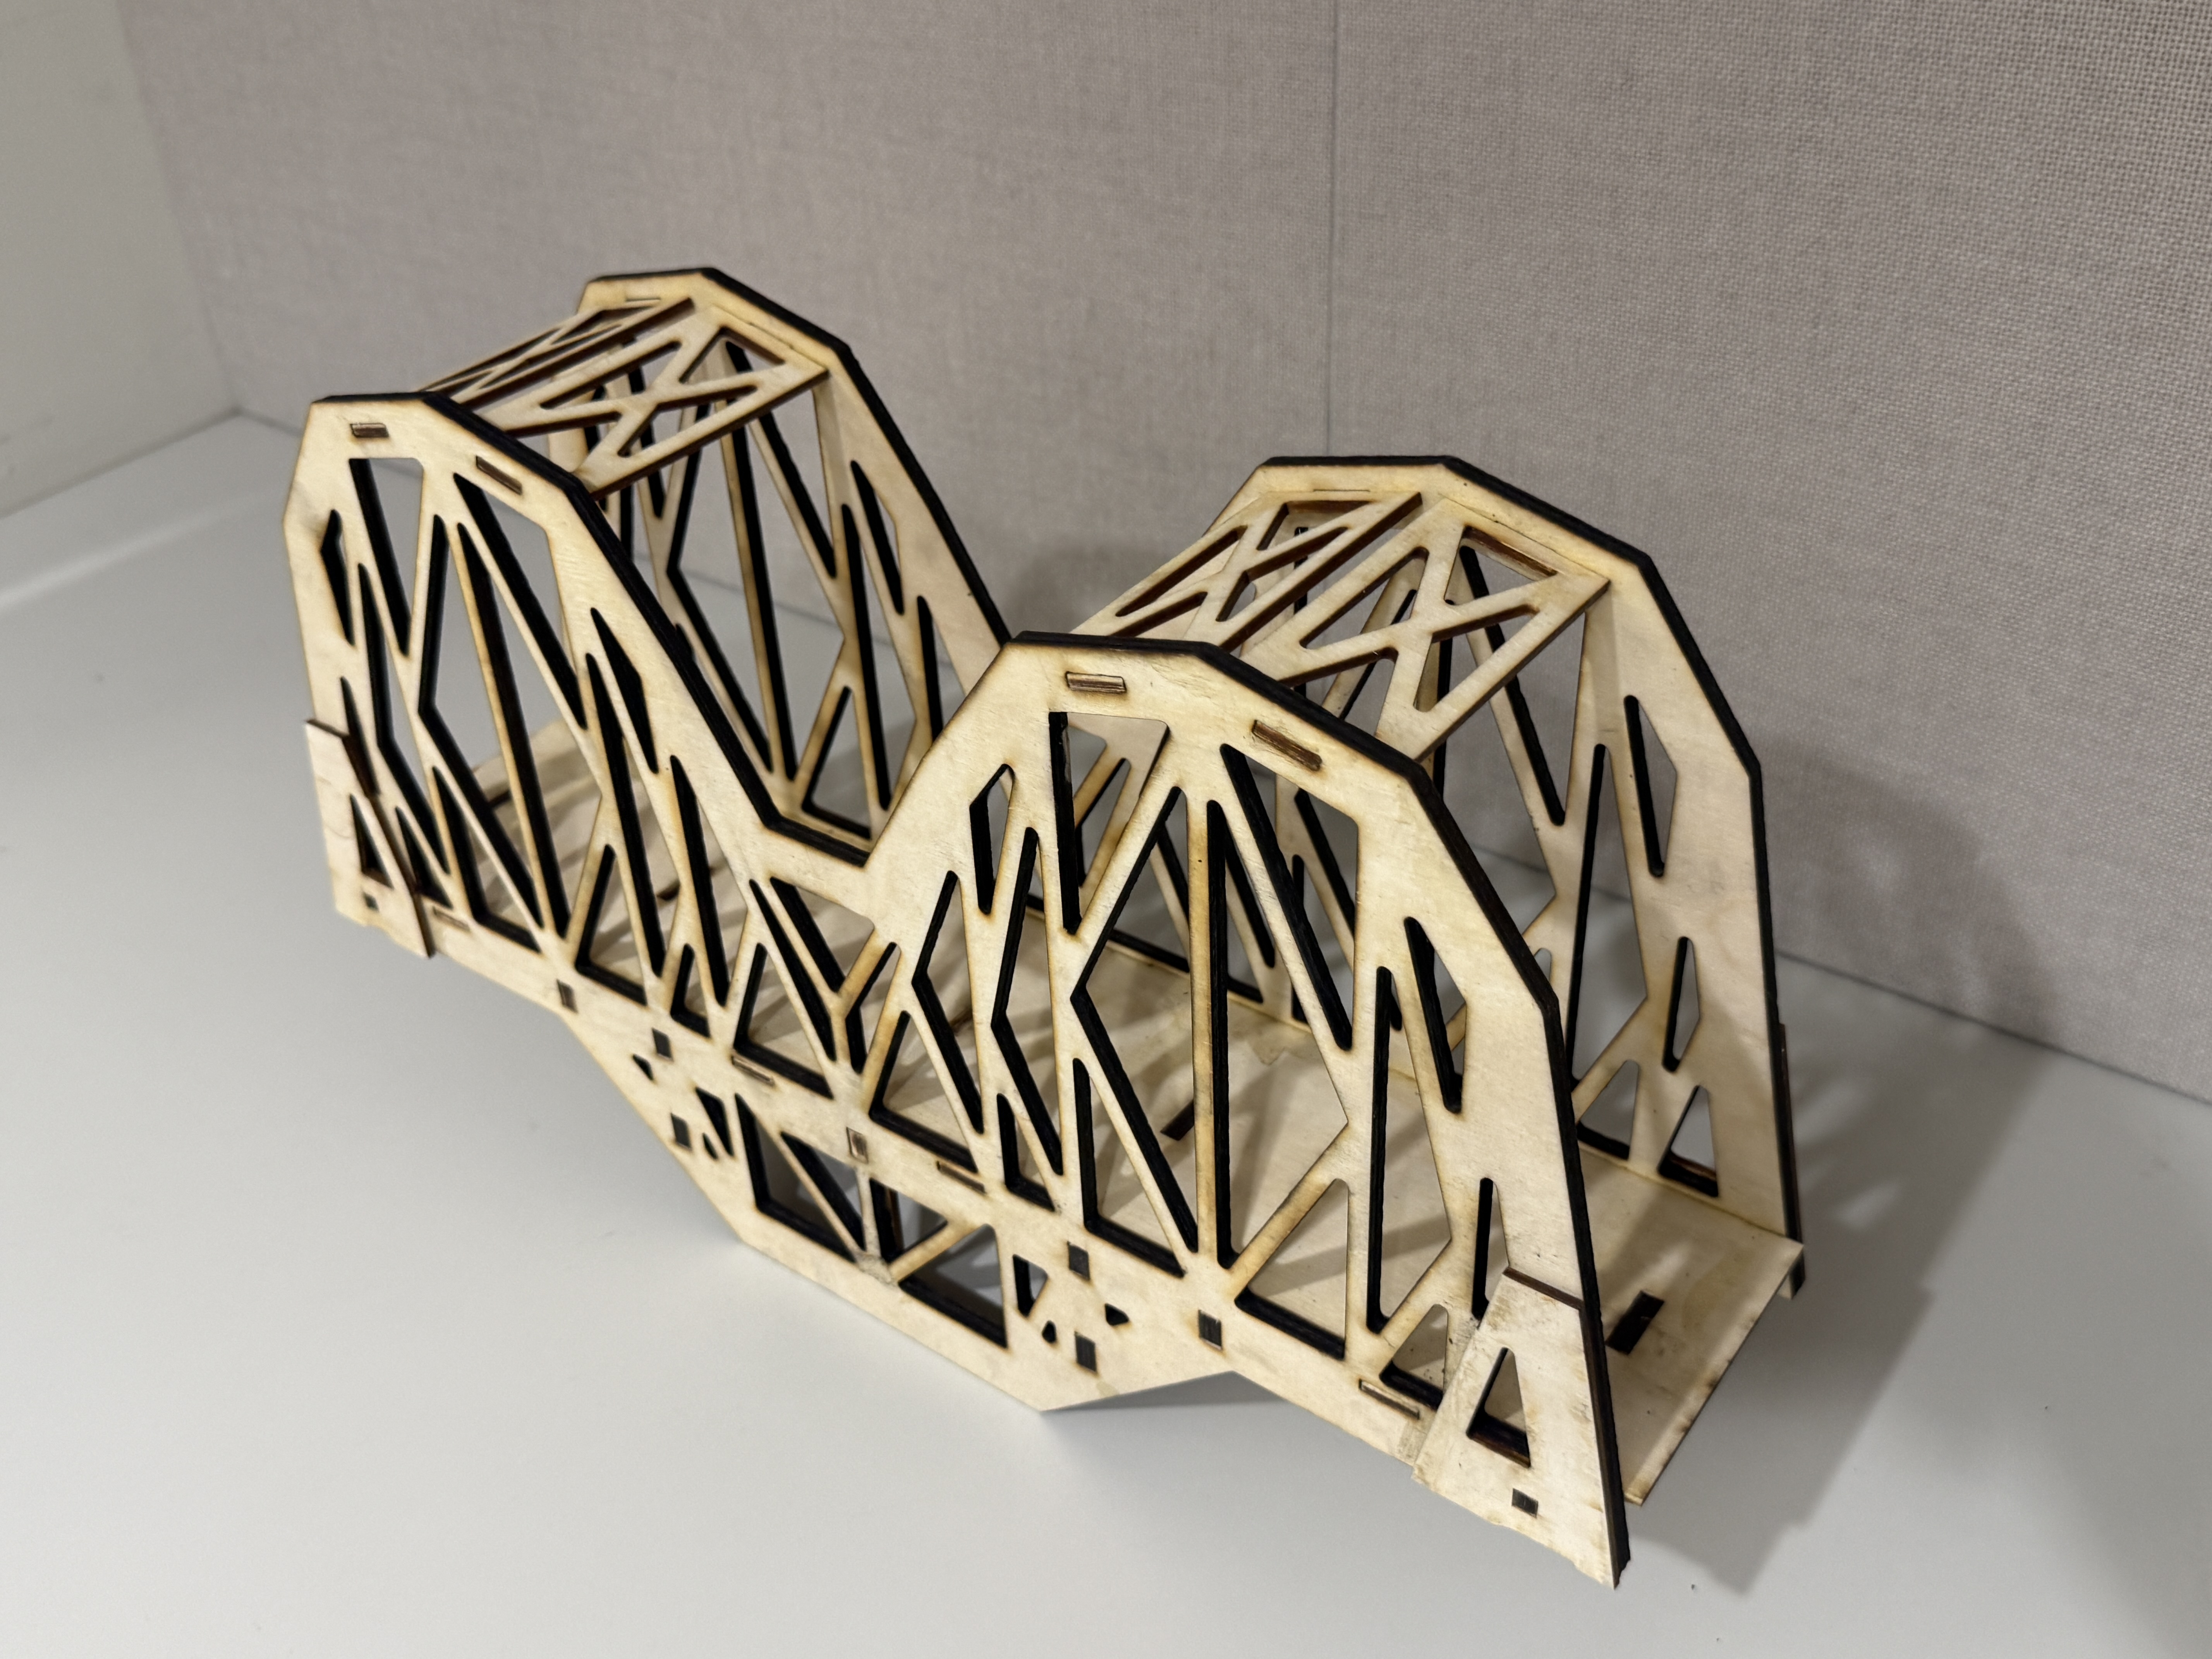
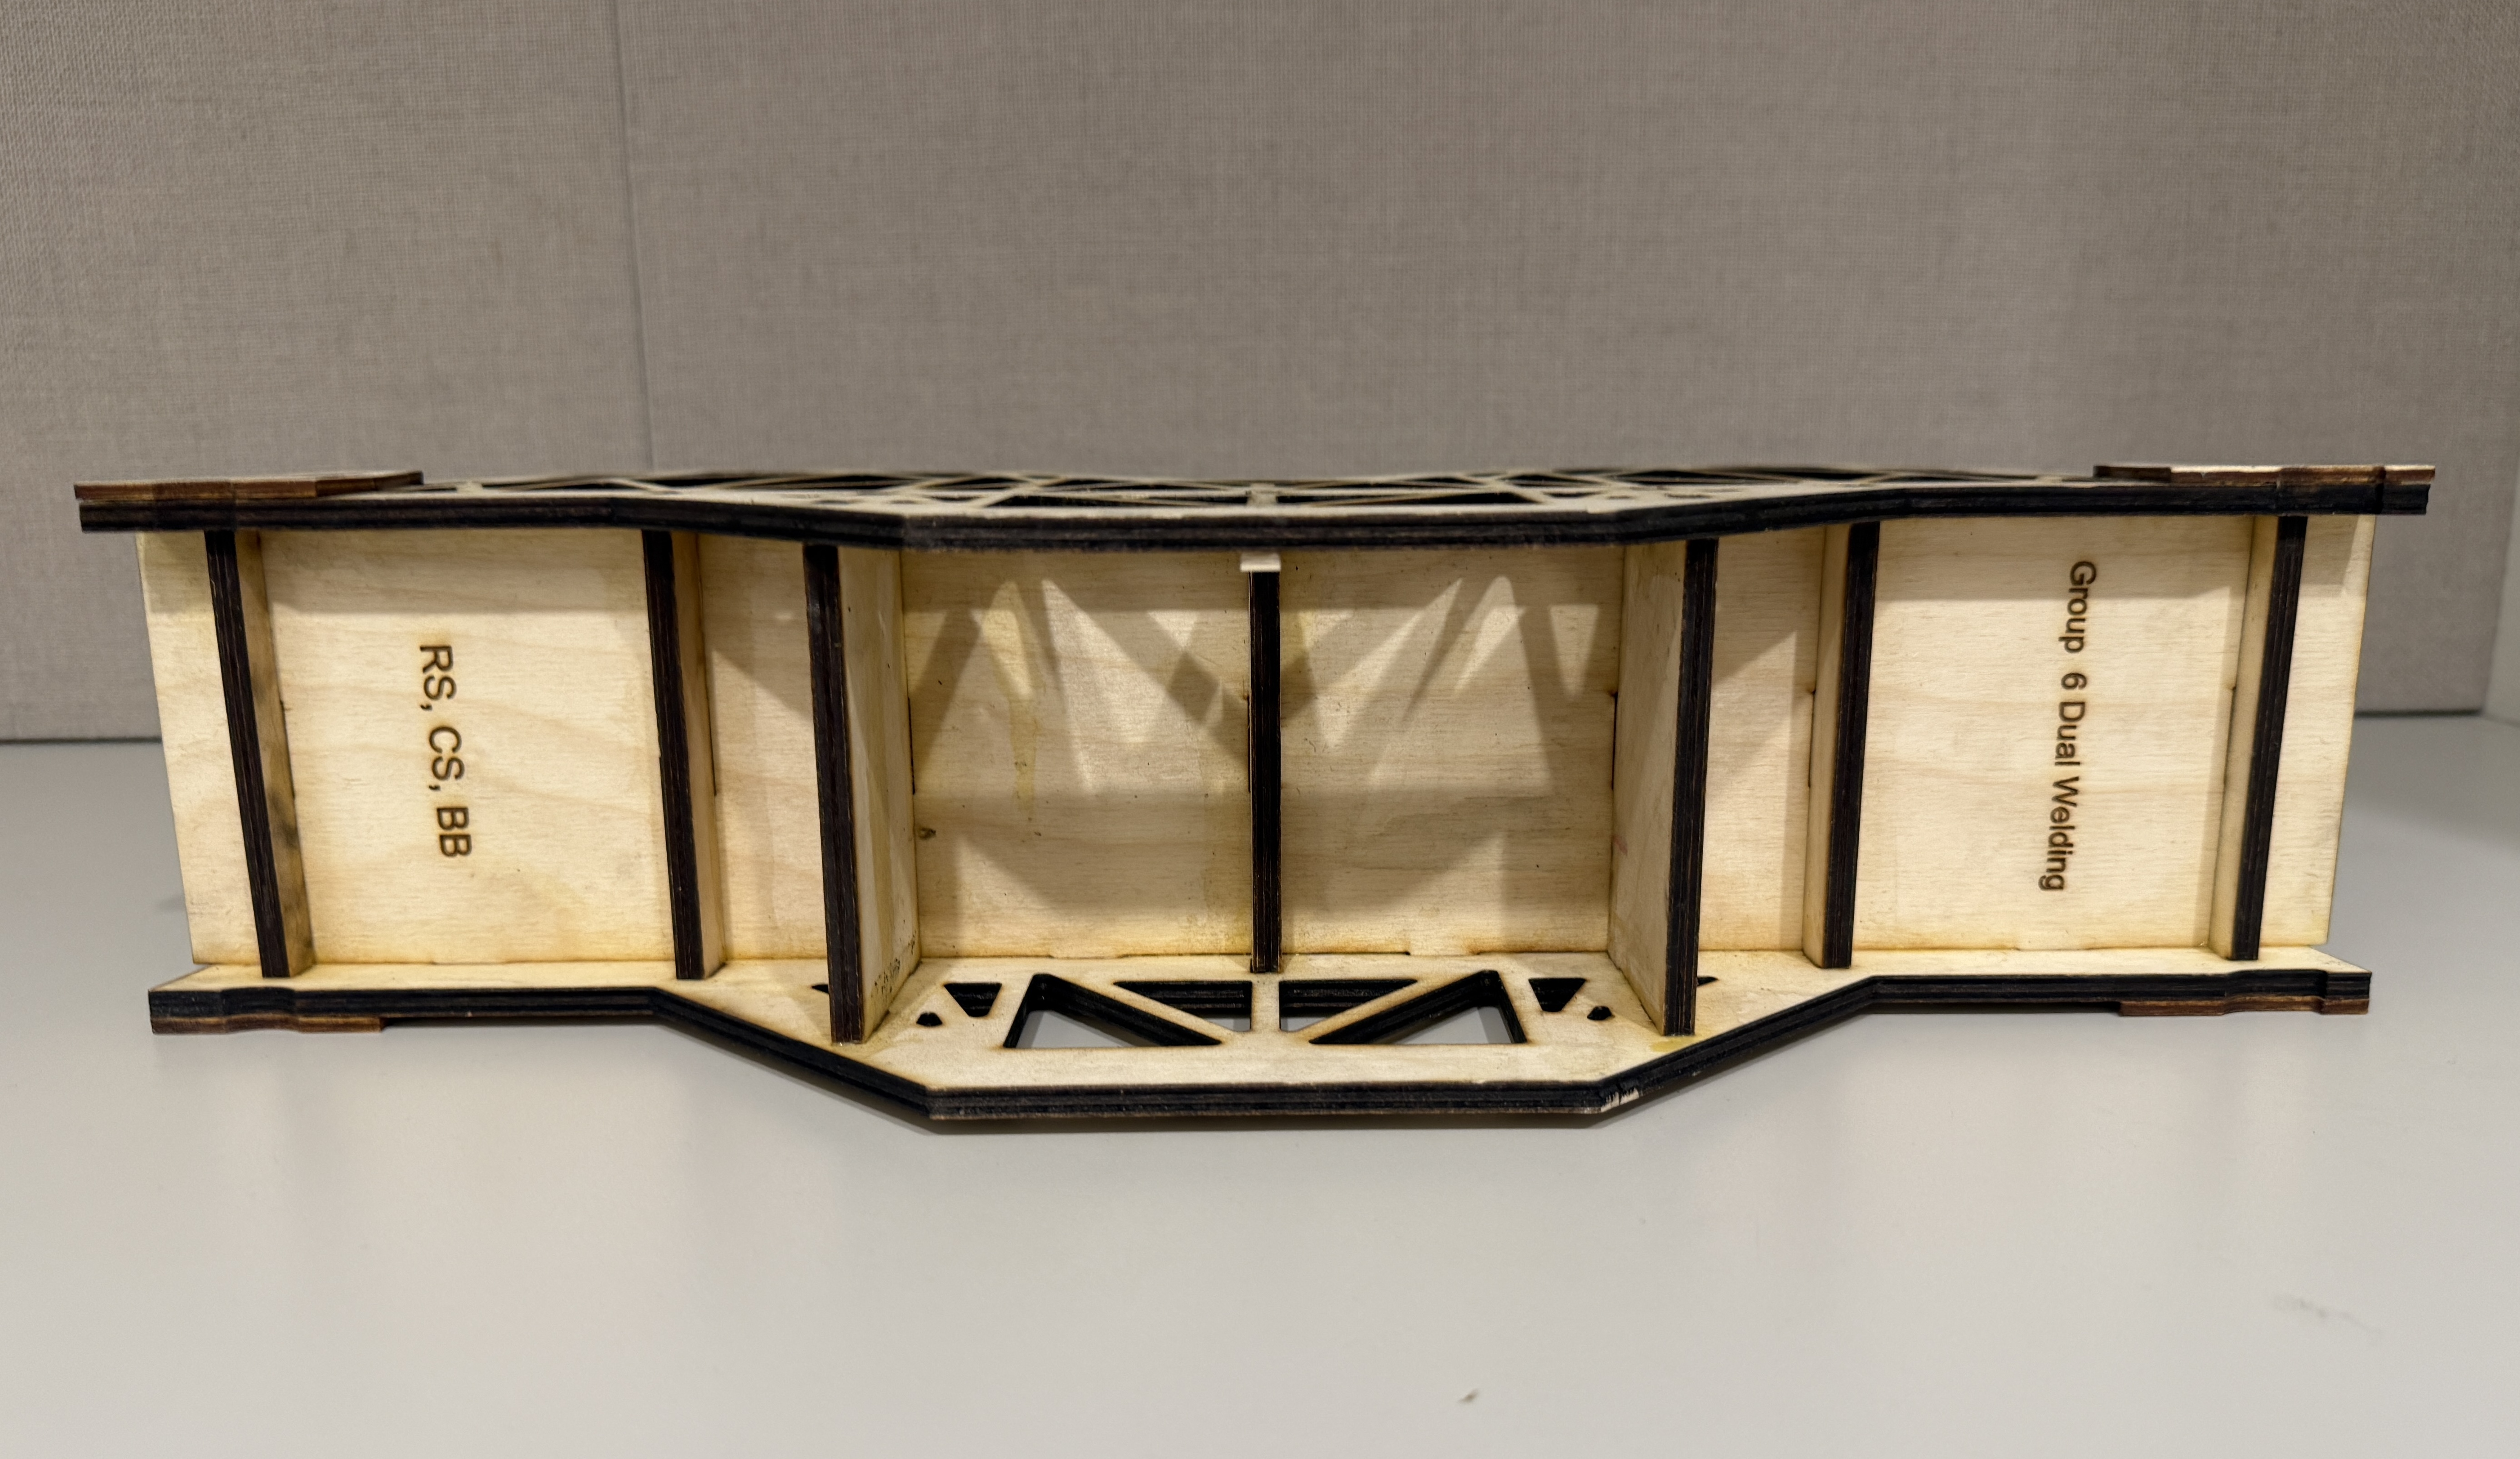
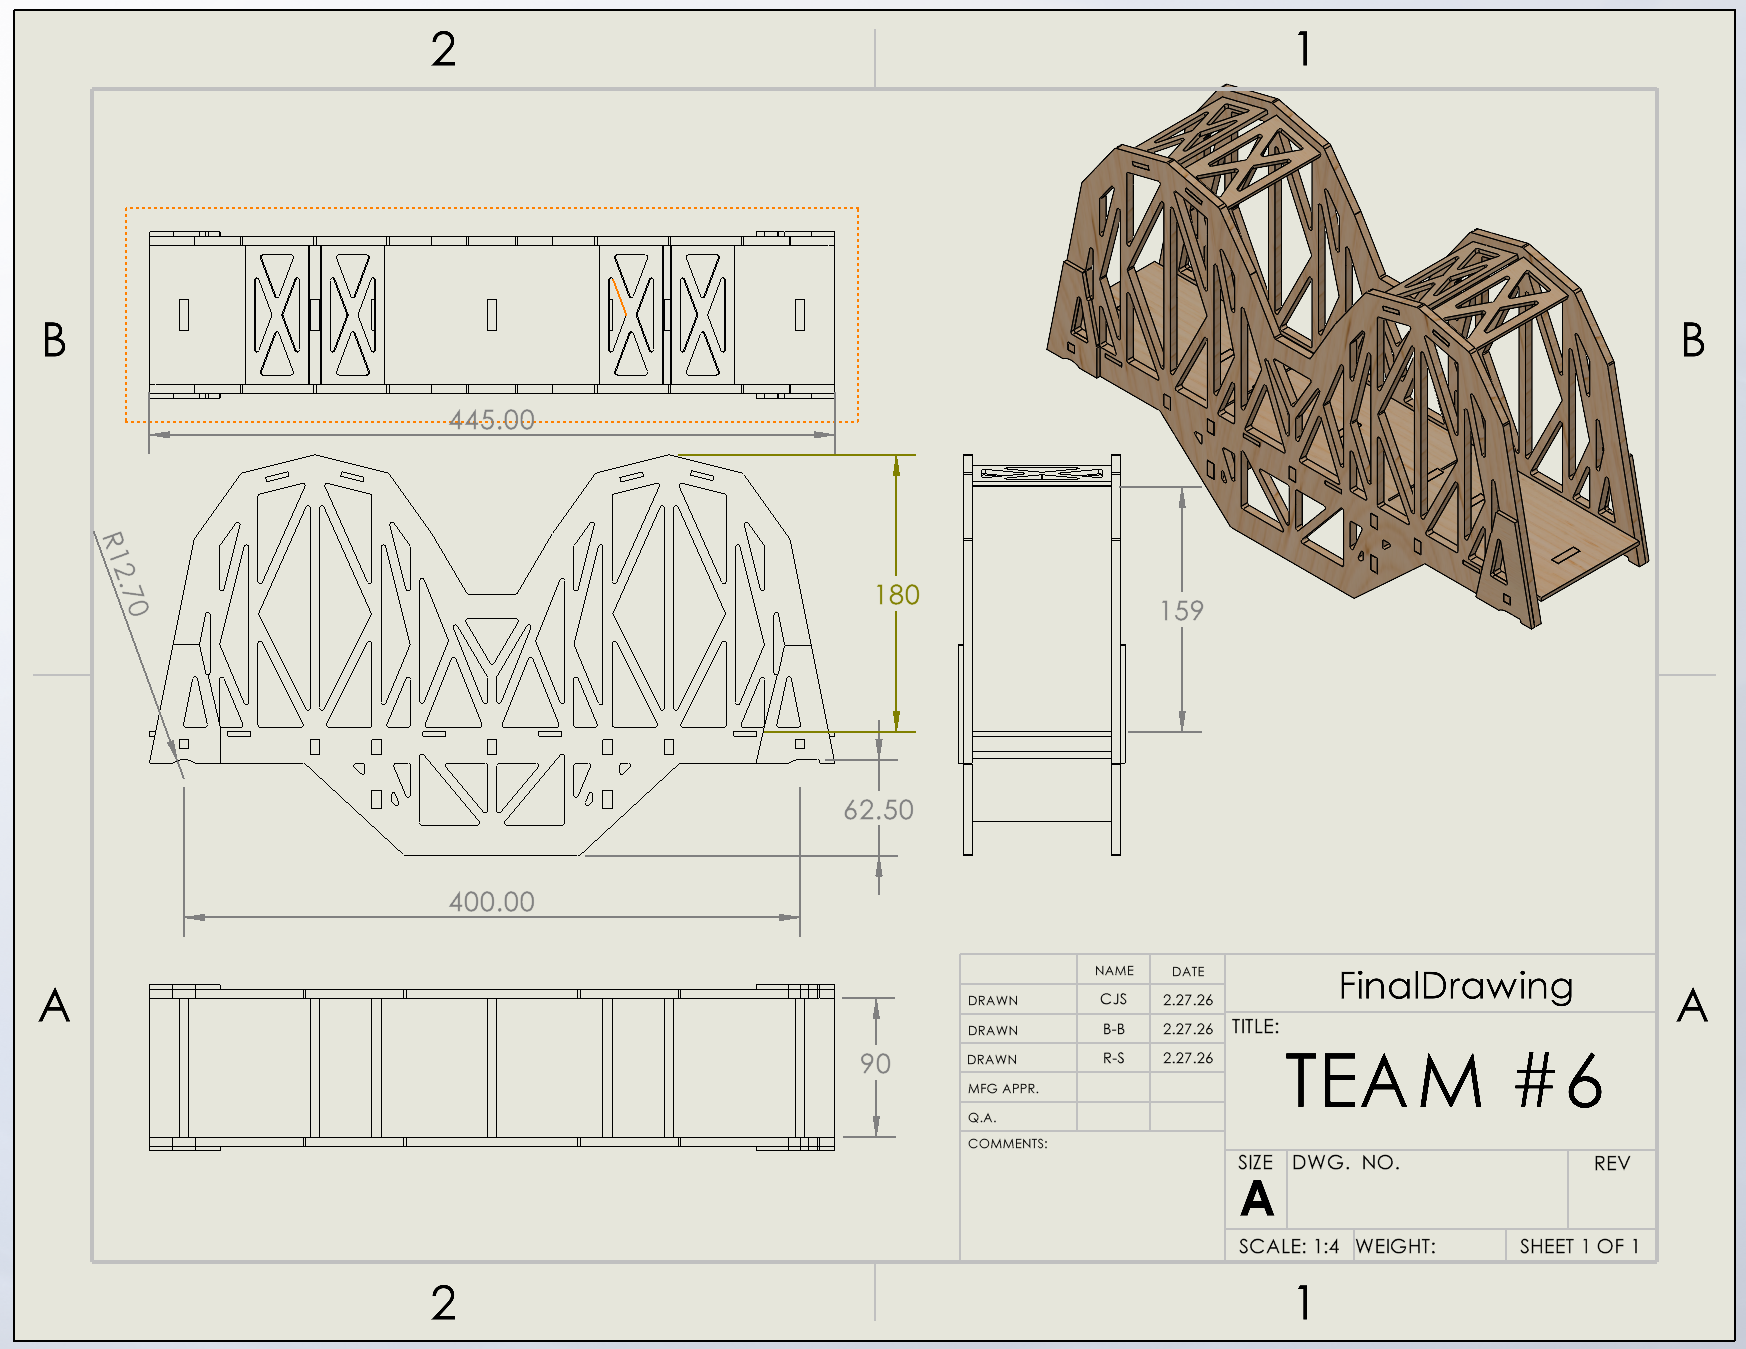
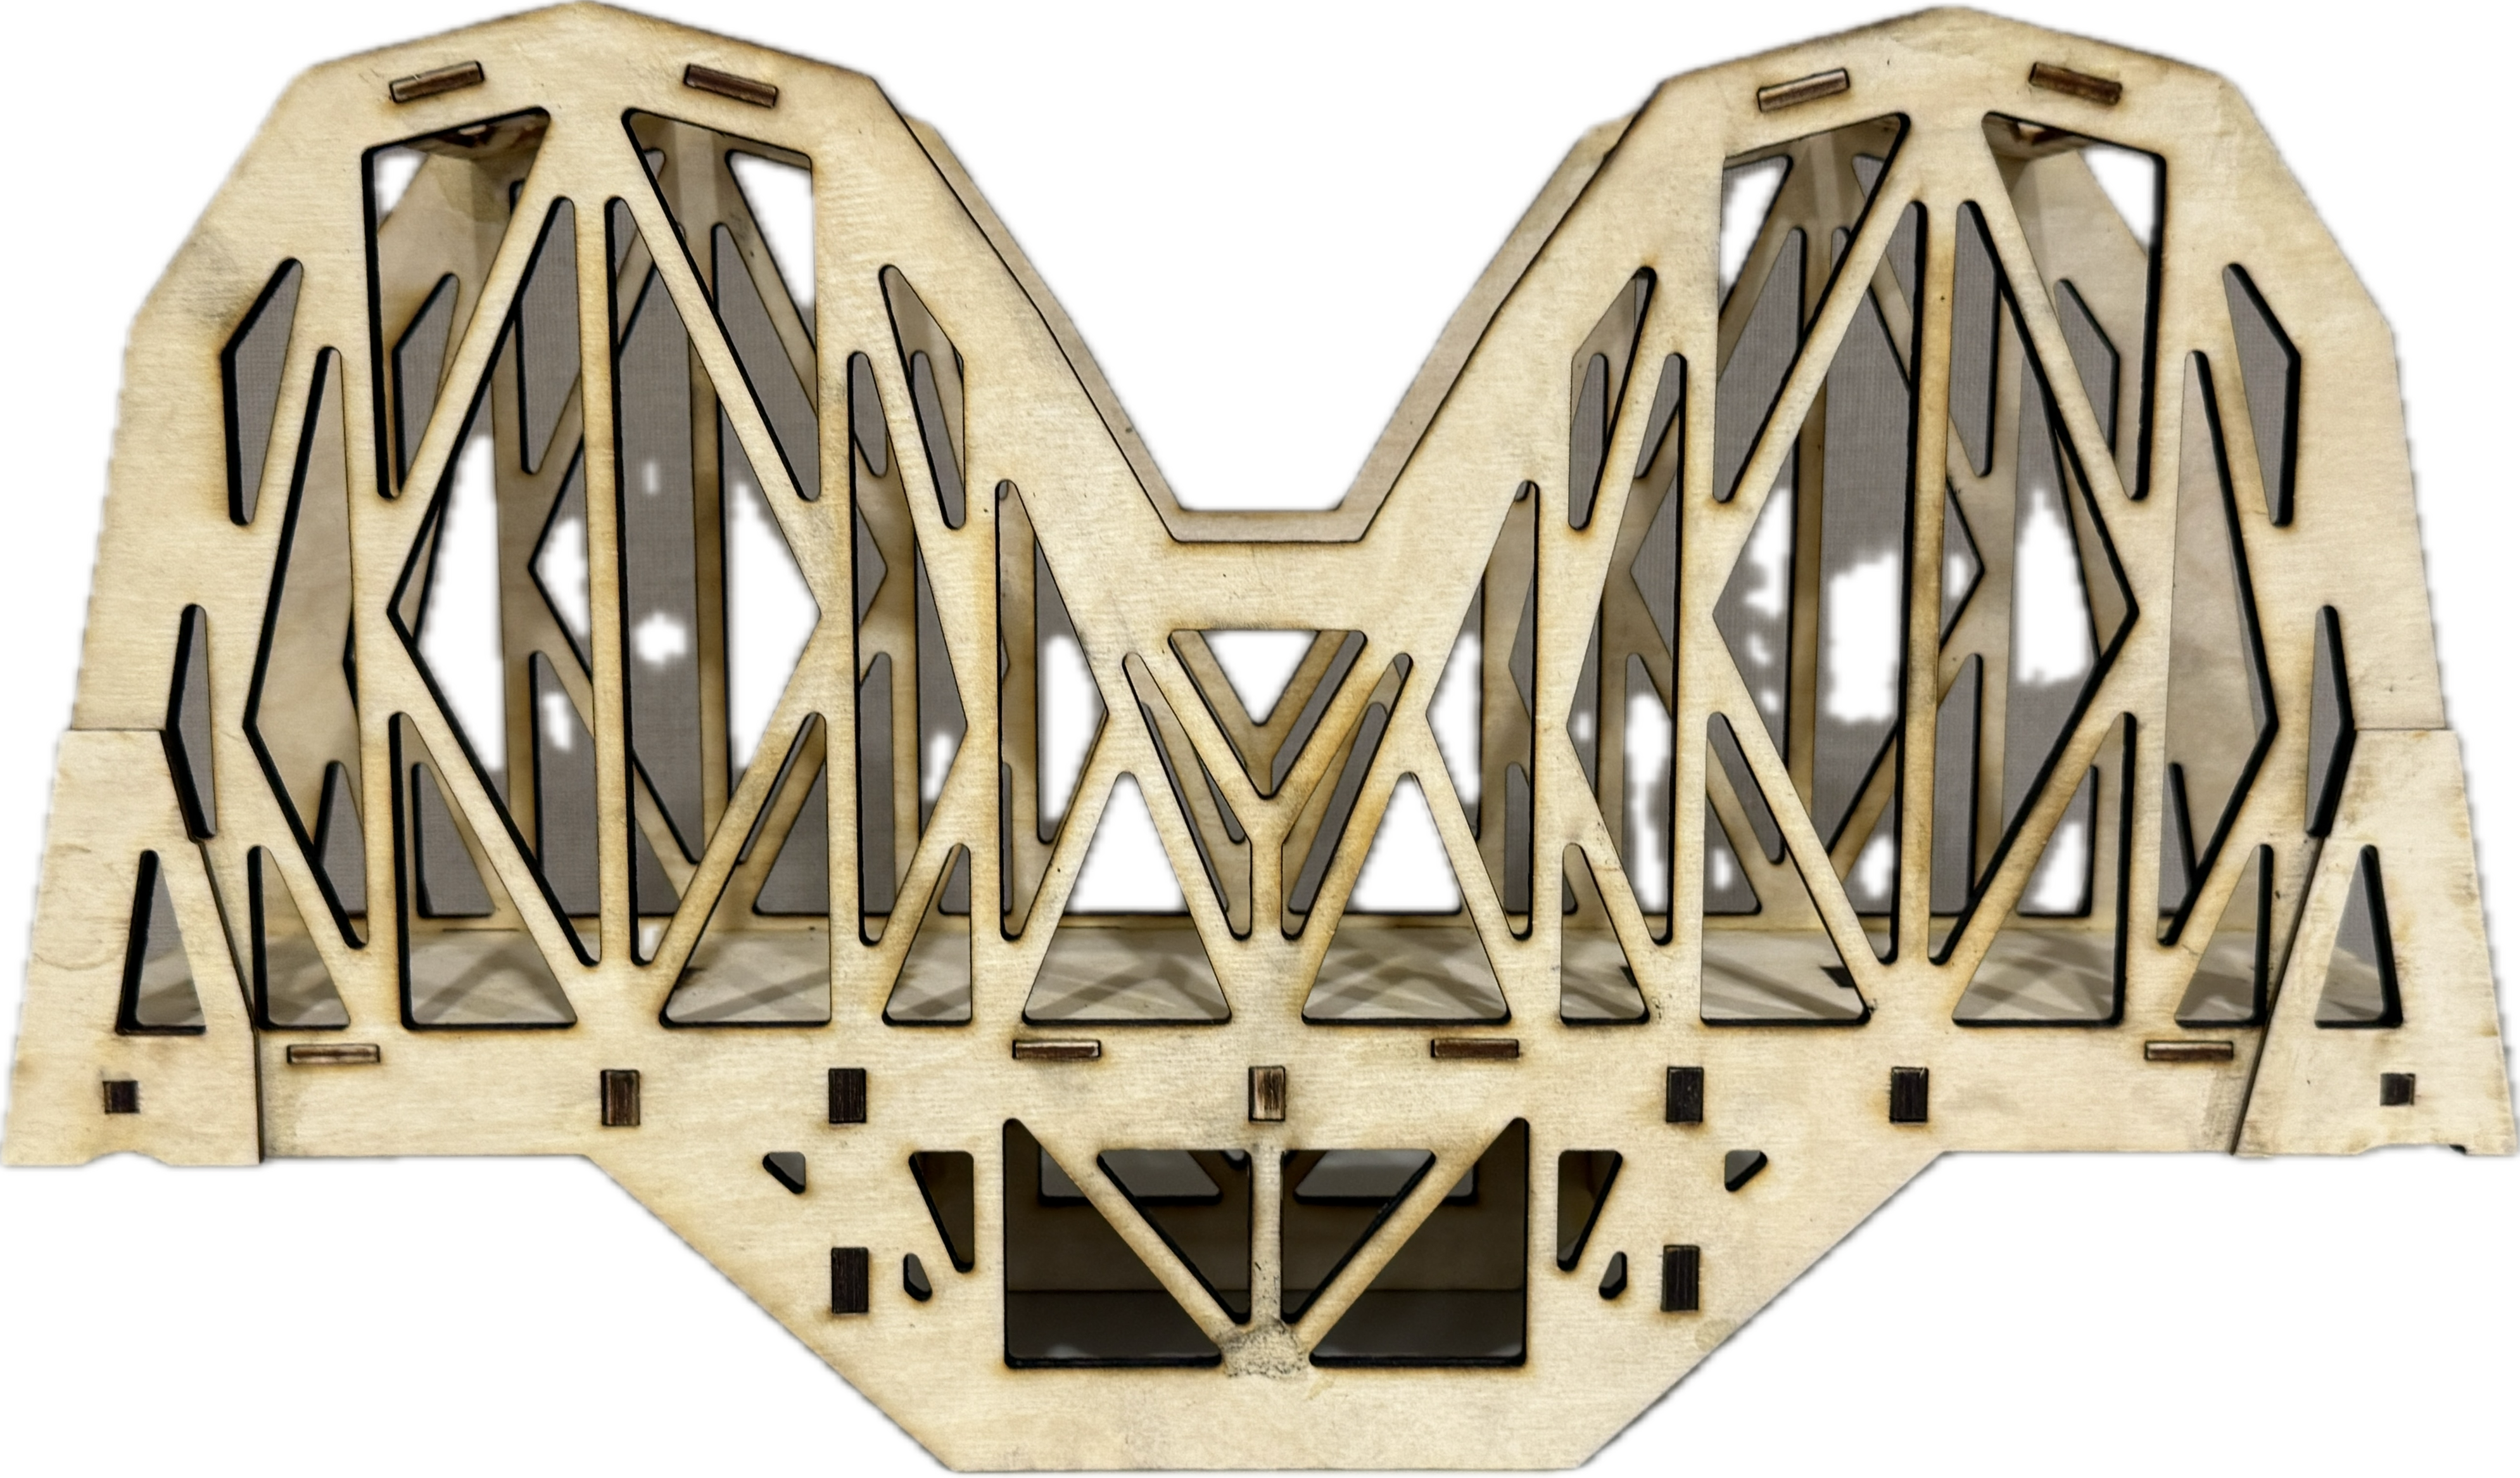
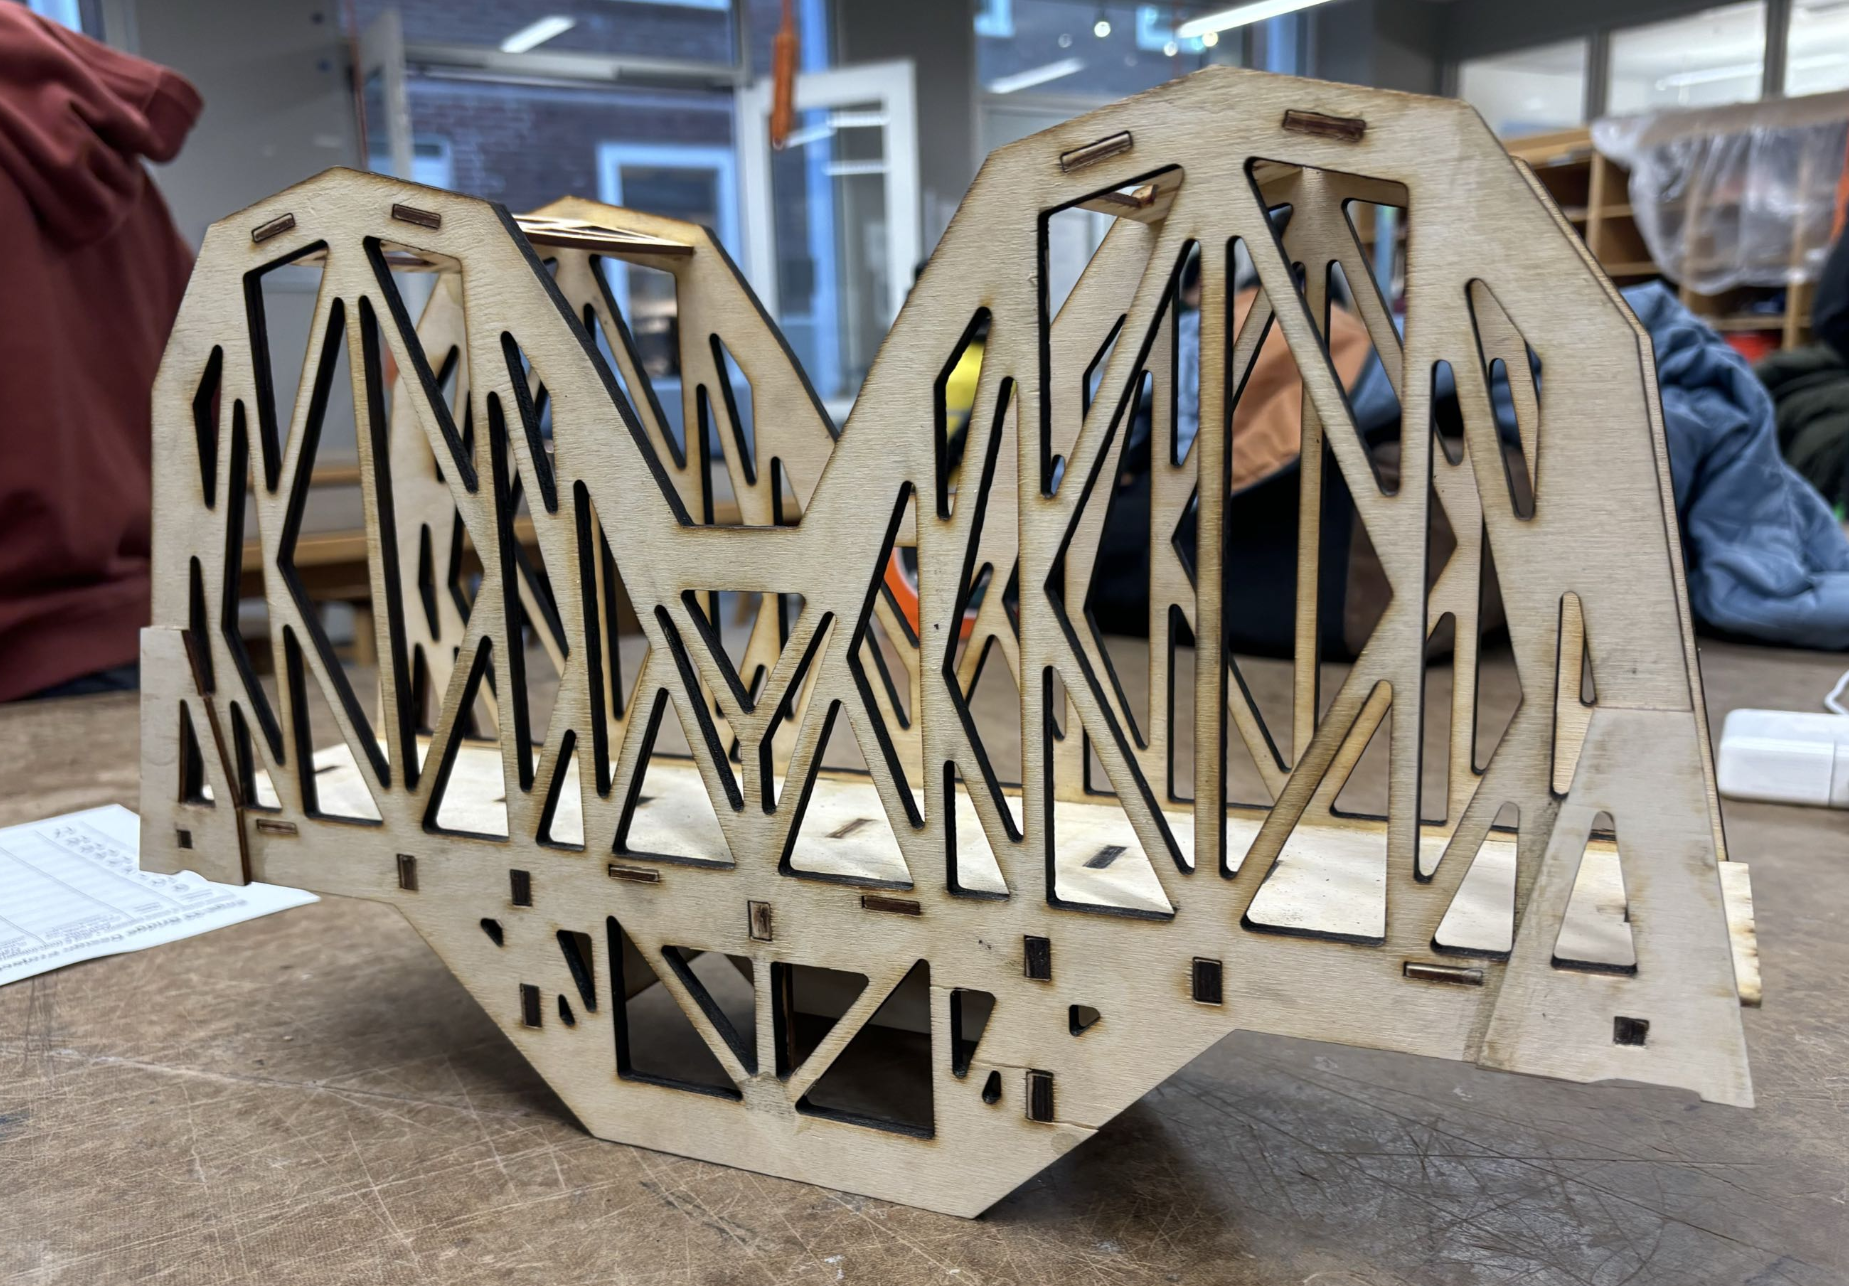
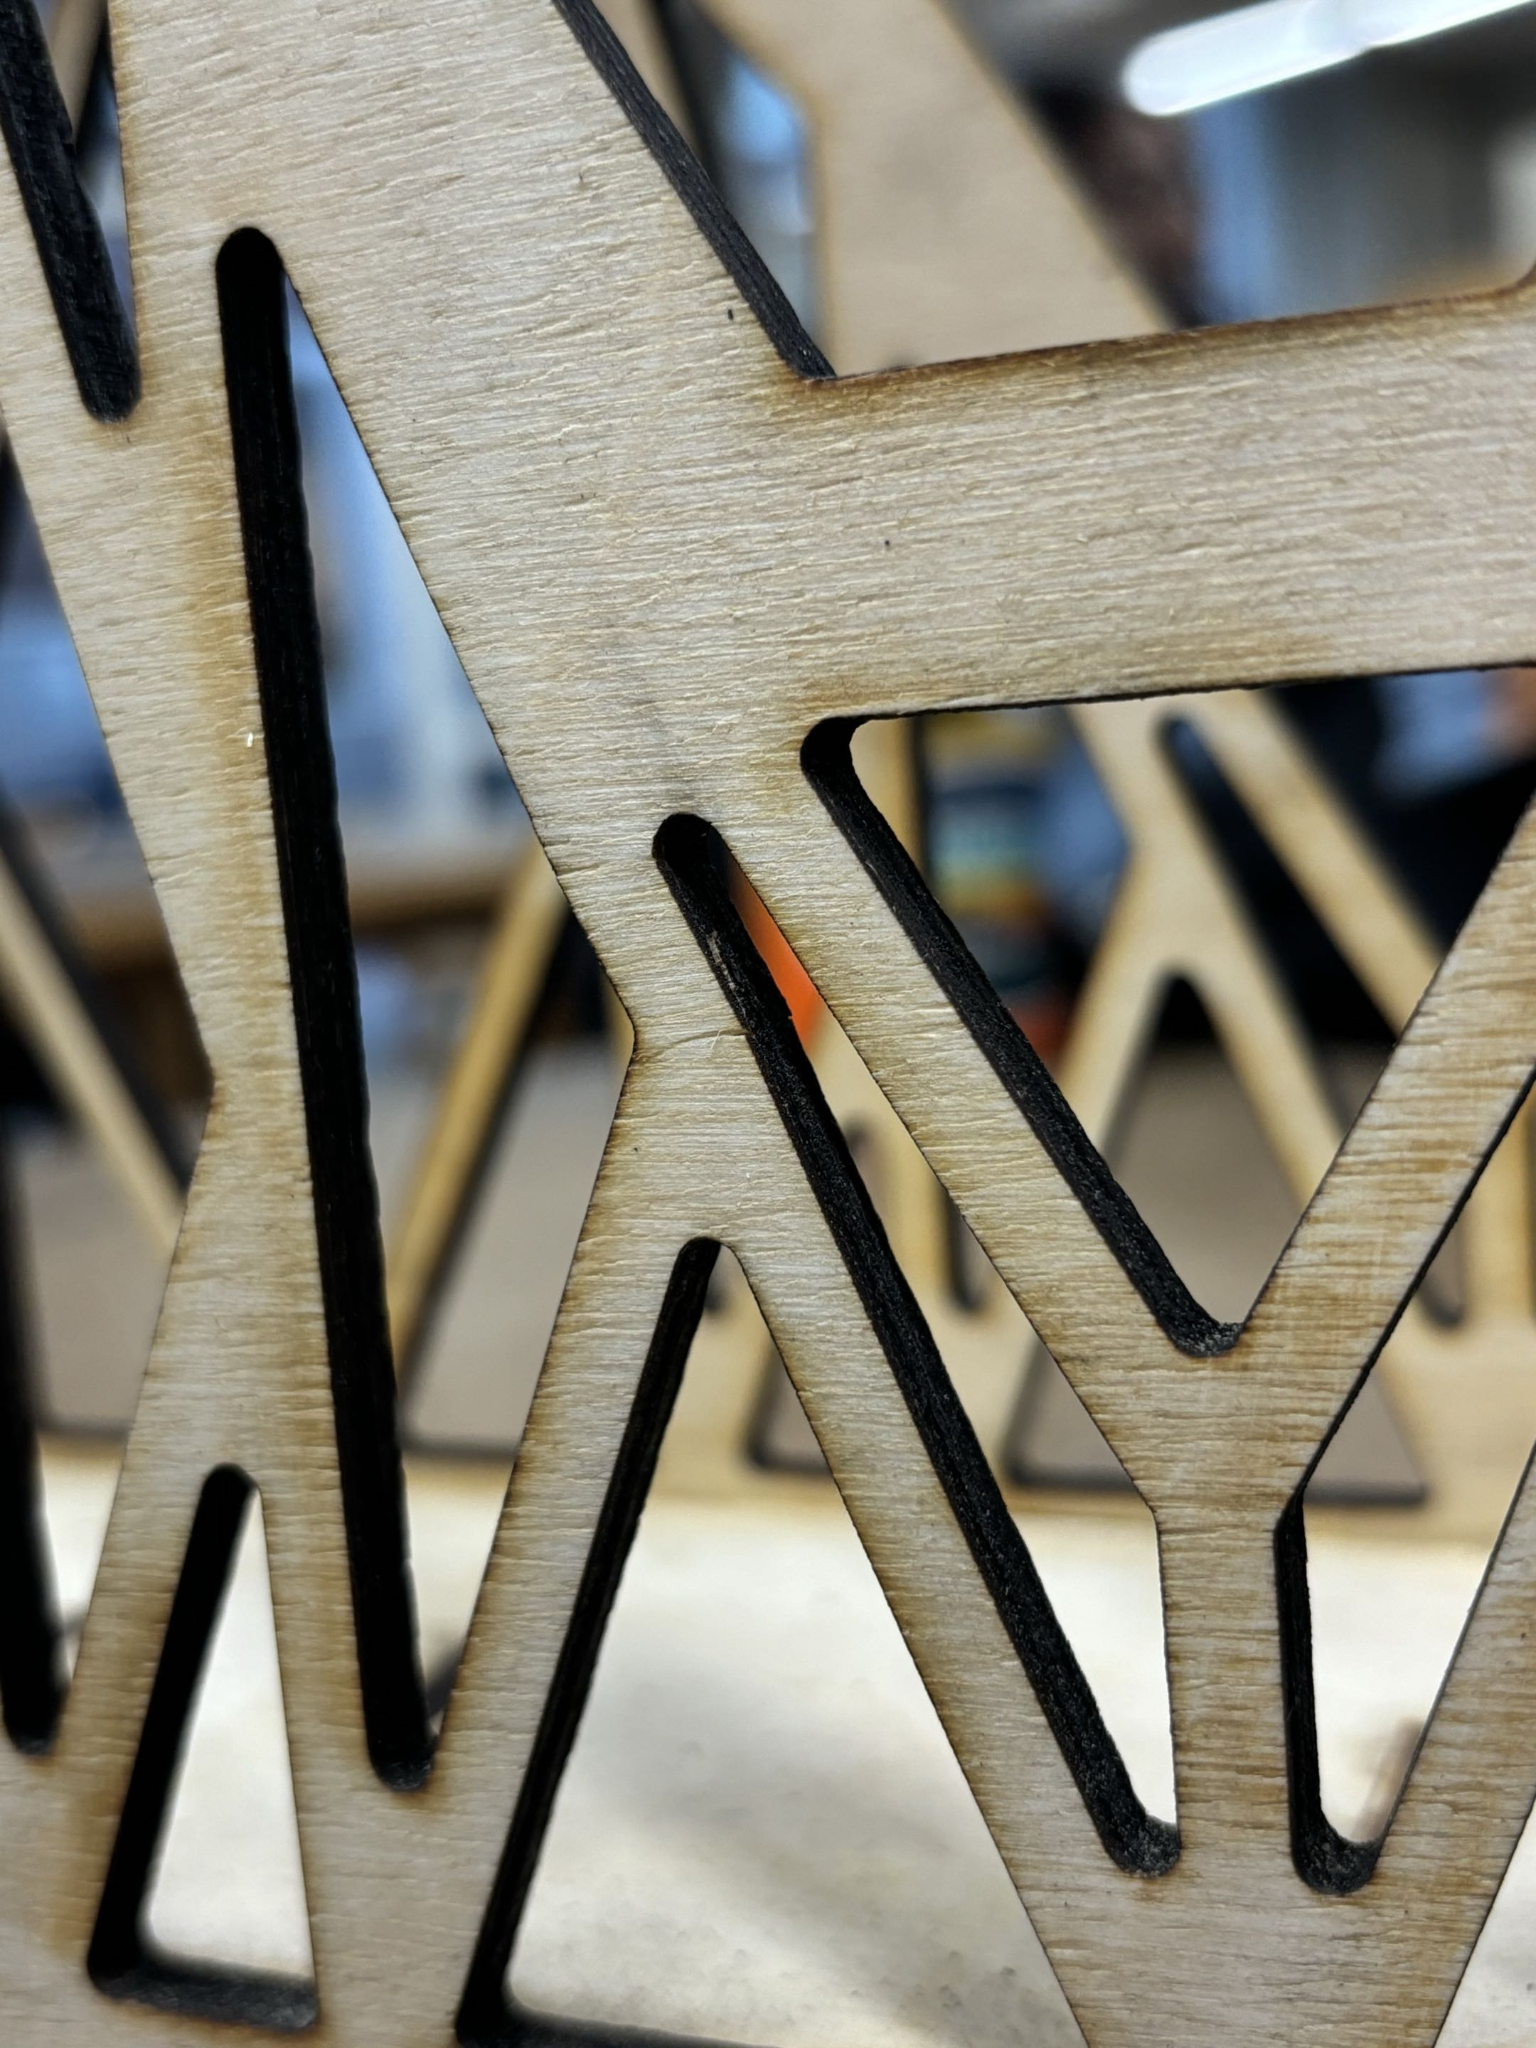
Final bridge: all pieces laser-cut, glued, and ready for testing.

SolidWorks bridge analysis
Von Mises plot
Ures plot

Prediction targets:

  1. Load at failure
  2. Total deflection between loads of 0.5-1.0 N
  3. Point on bridge of first failure (cracking, buckling, etc.)
Testing
Test setup

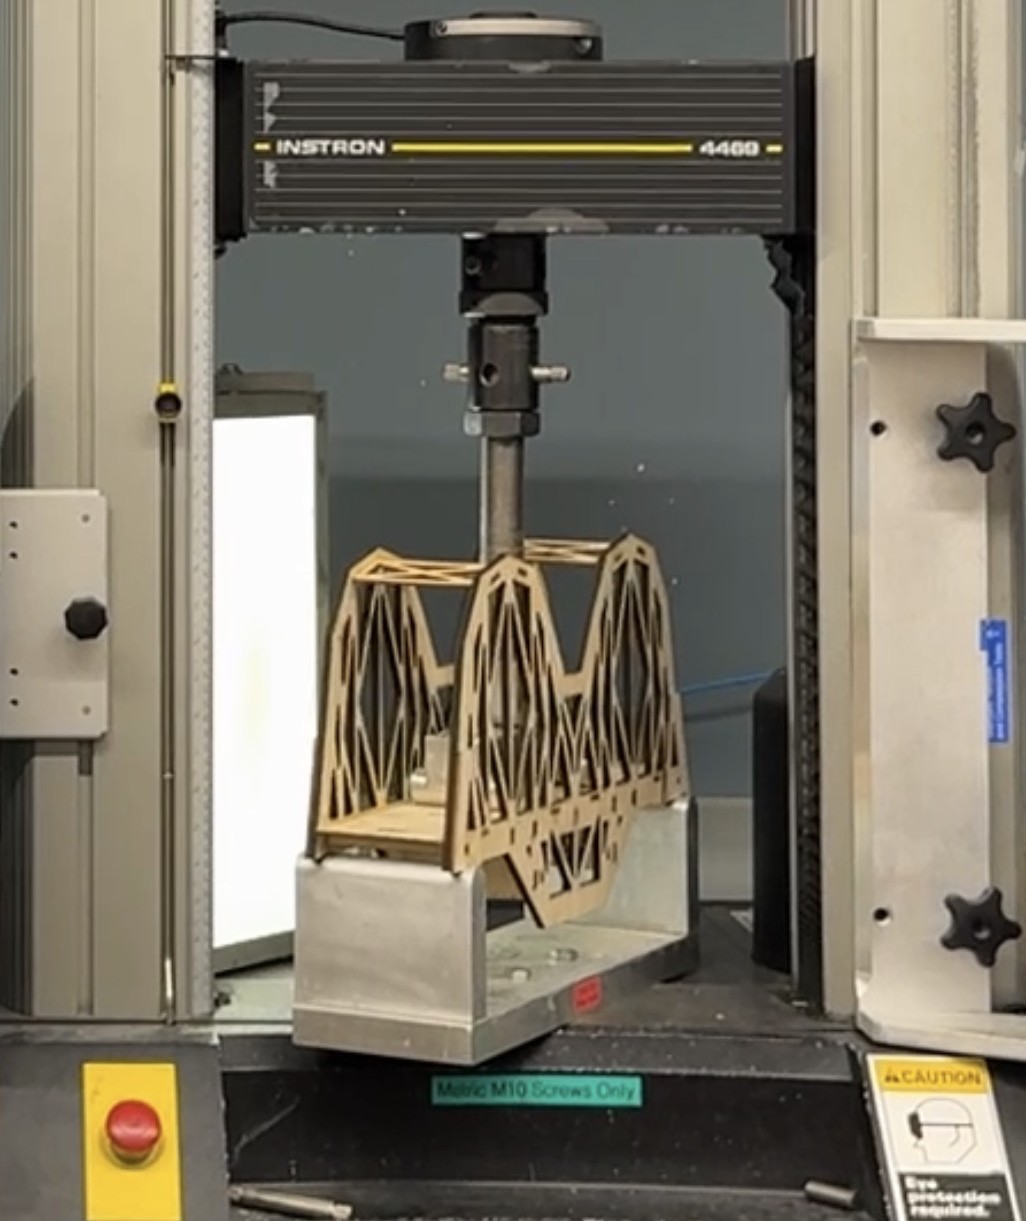
The bridge was tested under a centered loading configuration using the Instron. An increasing load is applied over time, with force and deflection measured continuously. Loading stops when the first failure point occurs (usually marked by a cracking sound).

Bridge testing setup
Instron load testing setup.
Results

Final Outcome

The final bridge successfully translated analytical design choices into measurable structural performance, while also revealing where real-world fabrication and connection effects differed from idealized models.

Load deflection curve
Comparison of SolidWorks-predicted vs. actual maximum load and deflection.
Bridge after testing
Bridge after testing looking pretty intact except for small crack (see below for close up).
Failure Point
Predicted failure point image
Predicted failure region (image view).
Predicted failure point von Mises plot
The highest-stress region (purple) indicates the predicted first-failure member (von Mises).
Observed failure point on bridge
Observed failure point after physical load testing: the same member failed first.

Sources of Error/Discussion

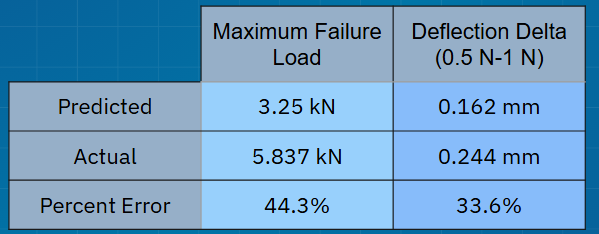
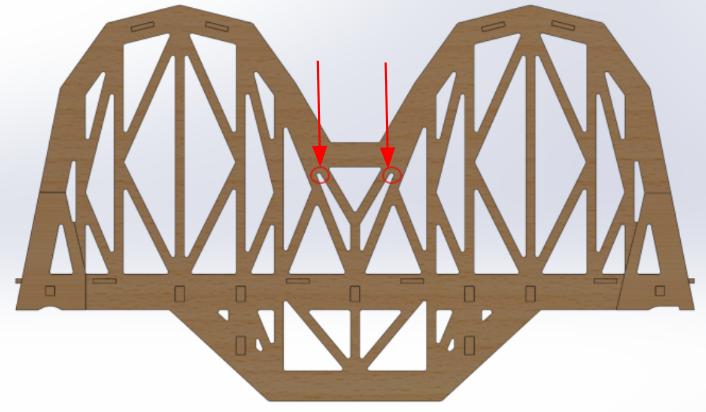
We predicted the correct member that would fail first! However, our max. load and deflection were both more conservative than the actual observed behavior.

  • Why was our analyses not super accurate?
    • Run smaller meshes when running FEA for more precise predictions.
    • Bridge may not have been flush with the Instron set up -- sanding support areas for better fit.
    • We were conservative when identifying the failure moment (and maximum stress) in the von Mises plot; a less conservative threshold could have predicted a higher maximum load.
  • If we had to try again...
    • Test various fillet radii (the bridge likely failed there because the fillet radii made those members very thin).
    • Our bridge was heavier than many others, which likely increased stress; we would better balance bridge mass with other design features.