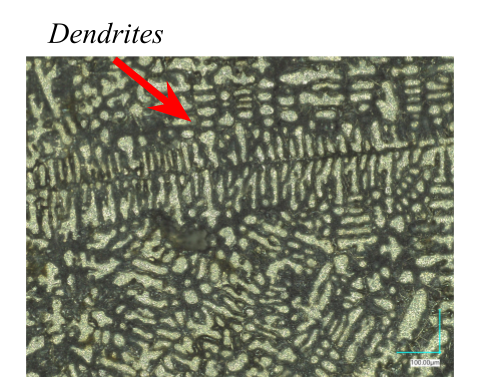
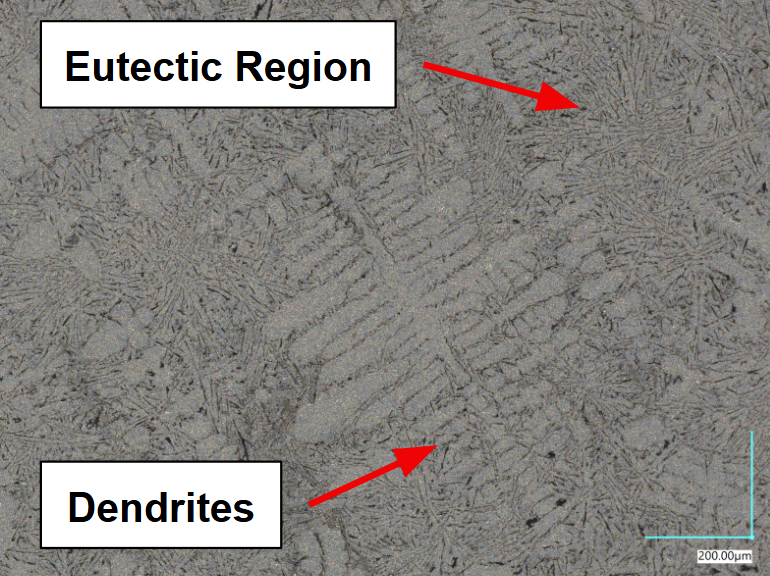
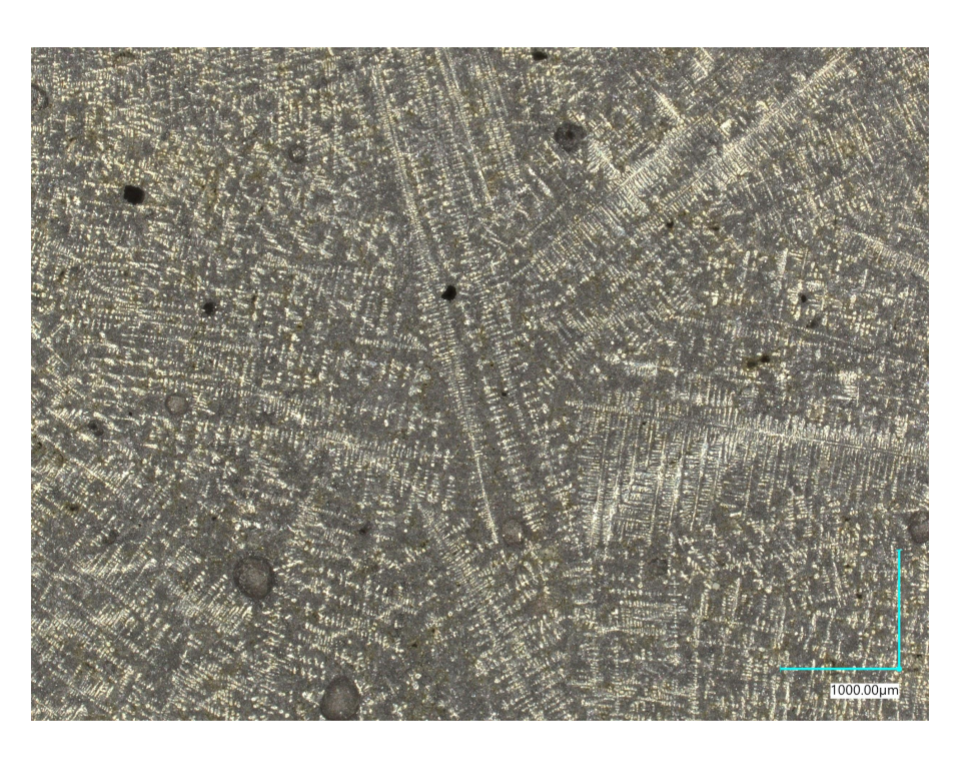
Casting Aluminum–Silicon Alloys

ENGS 24: Science of Materials · Final Project · Summer 2025
Experimental Approach
1) Casting
  • Making sand molds
  • 9 samples, varying from 0–25 wt% Si
  • 900 °C melt
2) Sample Preparation
  • Precision sectioning
  • Polishing to 0.3 µm
  • NaOH etching
3) Characterization
  • Optical microscopy
  • SEM imaging
  • Rockwell hardness
1). Sand casting and melt preparation of Al–Si alloys.
Sample preparation workflow for cast Al–Si alloys
2) and 3). Sample preparation workflow: sectioning, polishing, and etching prior to microscopy.
Microstructure vs Silicon Content
6% Si microstructure
6 wt% Si — dendritic Al matrix
12.6% Si microstructure
12.6 wt% Si — eutectic structure
25% Si microstructure
25 wt% Si — primary Si crystals
Effect of Cooling Rate
Fast cooling

Fast Cooling
Dendrite-dominated structure
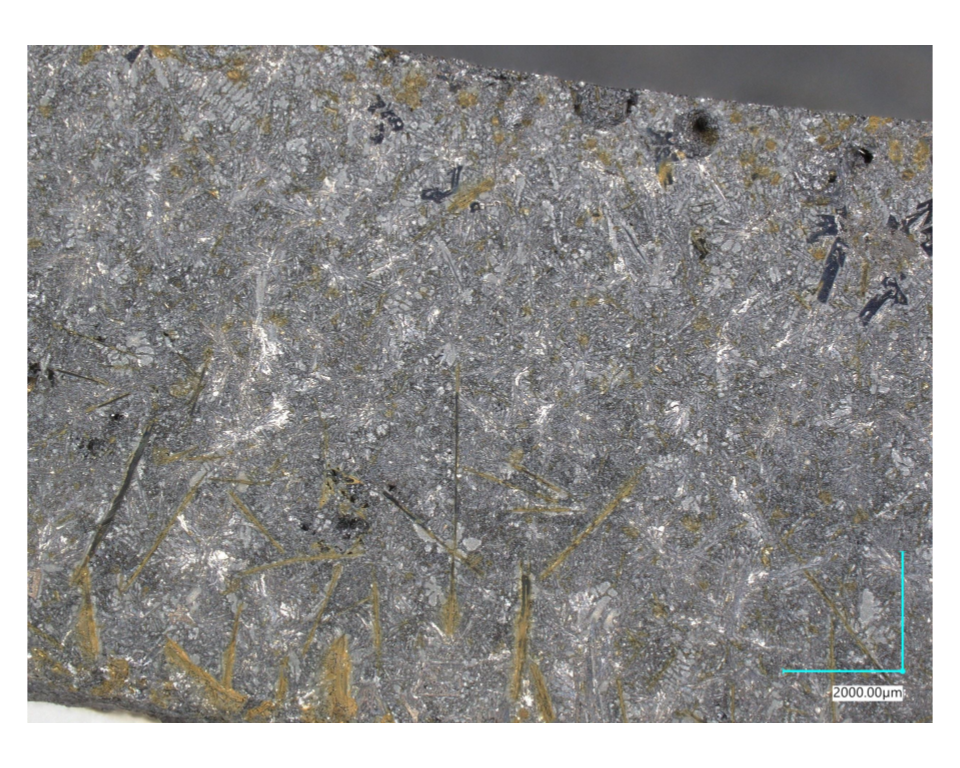
Slow cooling

Slow Cooling
Eutectic-dominated structure

  • Fast cooling: directional and uneven; Al dendrites solidify first
  • Slow cooling: more uniform; eutectic solidification produces interwoven Al–Si
Conclusions/Results: Structure–Property Relationship
Hardness vs Si
Note: the orange and blue points represent samples that went through two seperate sample preperation steps as one of the machines broke during the term. Although a difference can be seen in the hardness values, the overall trend still holds true.

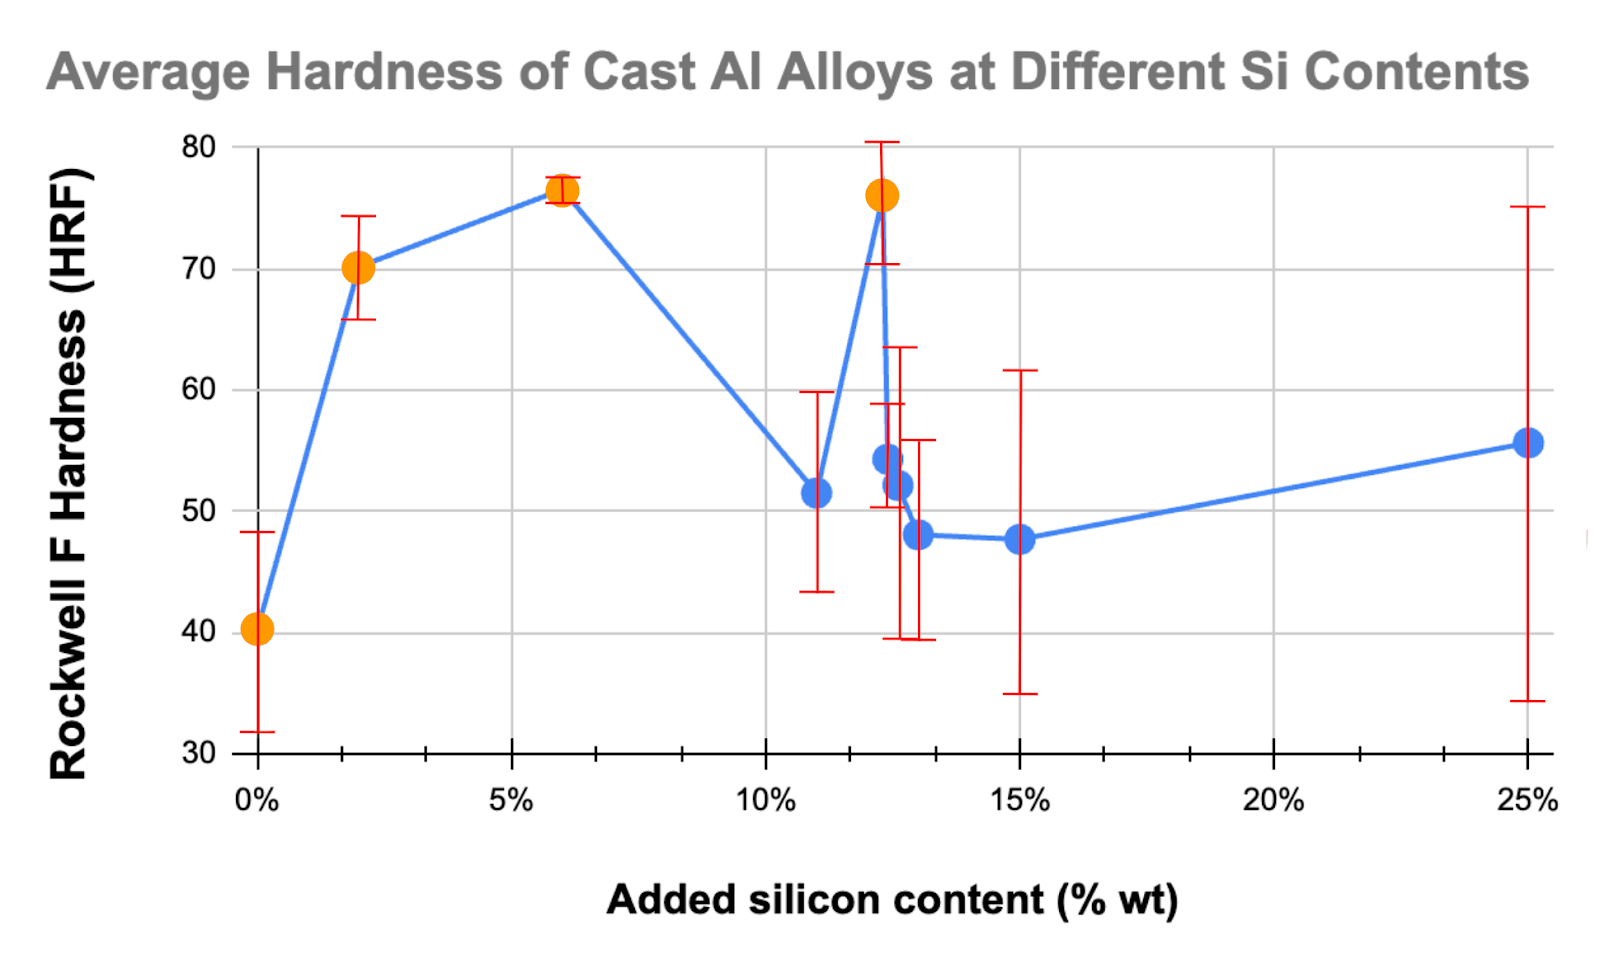
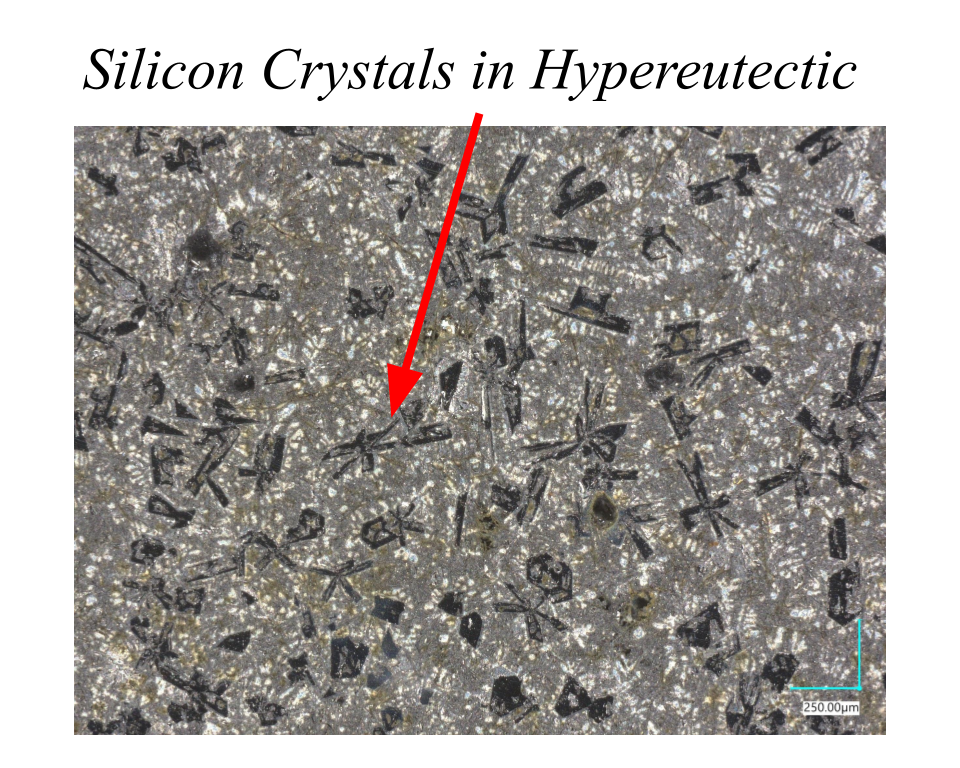
Hardness seems to correlate with what the microstructure looks like (which is dictated by the % of Si)! Hardness increases with silicon content up to the eutectic composition, where fine interwoven phases impede dislocation motion. At higher silicon levels where there are large primary Si crystals, brittleness increased. (See Microstructure vs Silicon Content Effect of cooling rates.)

Deliverables (for more detailed reading about the project!)